


The parameters displayed on this pages are either :
- radar parameter: NRCS
- geophysical parameters: wind speed, effective Hs.
Values are averaged on each datatake (i.e. one value per imagette). 2 filters are applied:
- distance-to-coast filter (i.e. center of images closer than 100km are rejected).
- Observations below -55° South and above +55° North are filtered out to remove acquisitions over sea ice.
Geophysical parameters (wind speed and effective Hs), input data is Level-2 OCN products. The Geophysical model Function (GMF) currently considered is CMOD5n.
1 VV polarisation
VV polarisation is the nominal configuration for the WV Sentinel-1 acquisitions.
1.1 WV NRCS SLC products
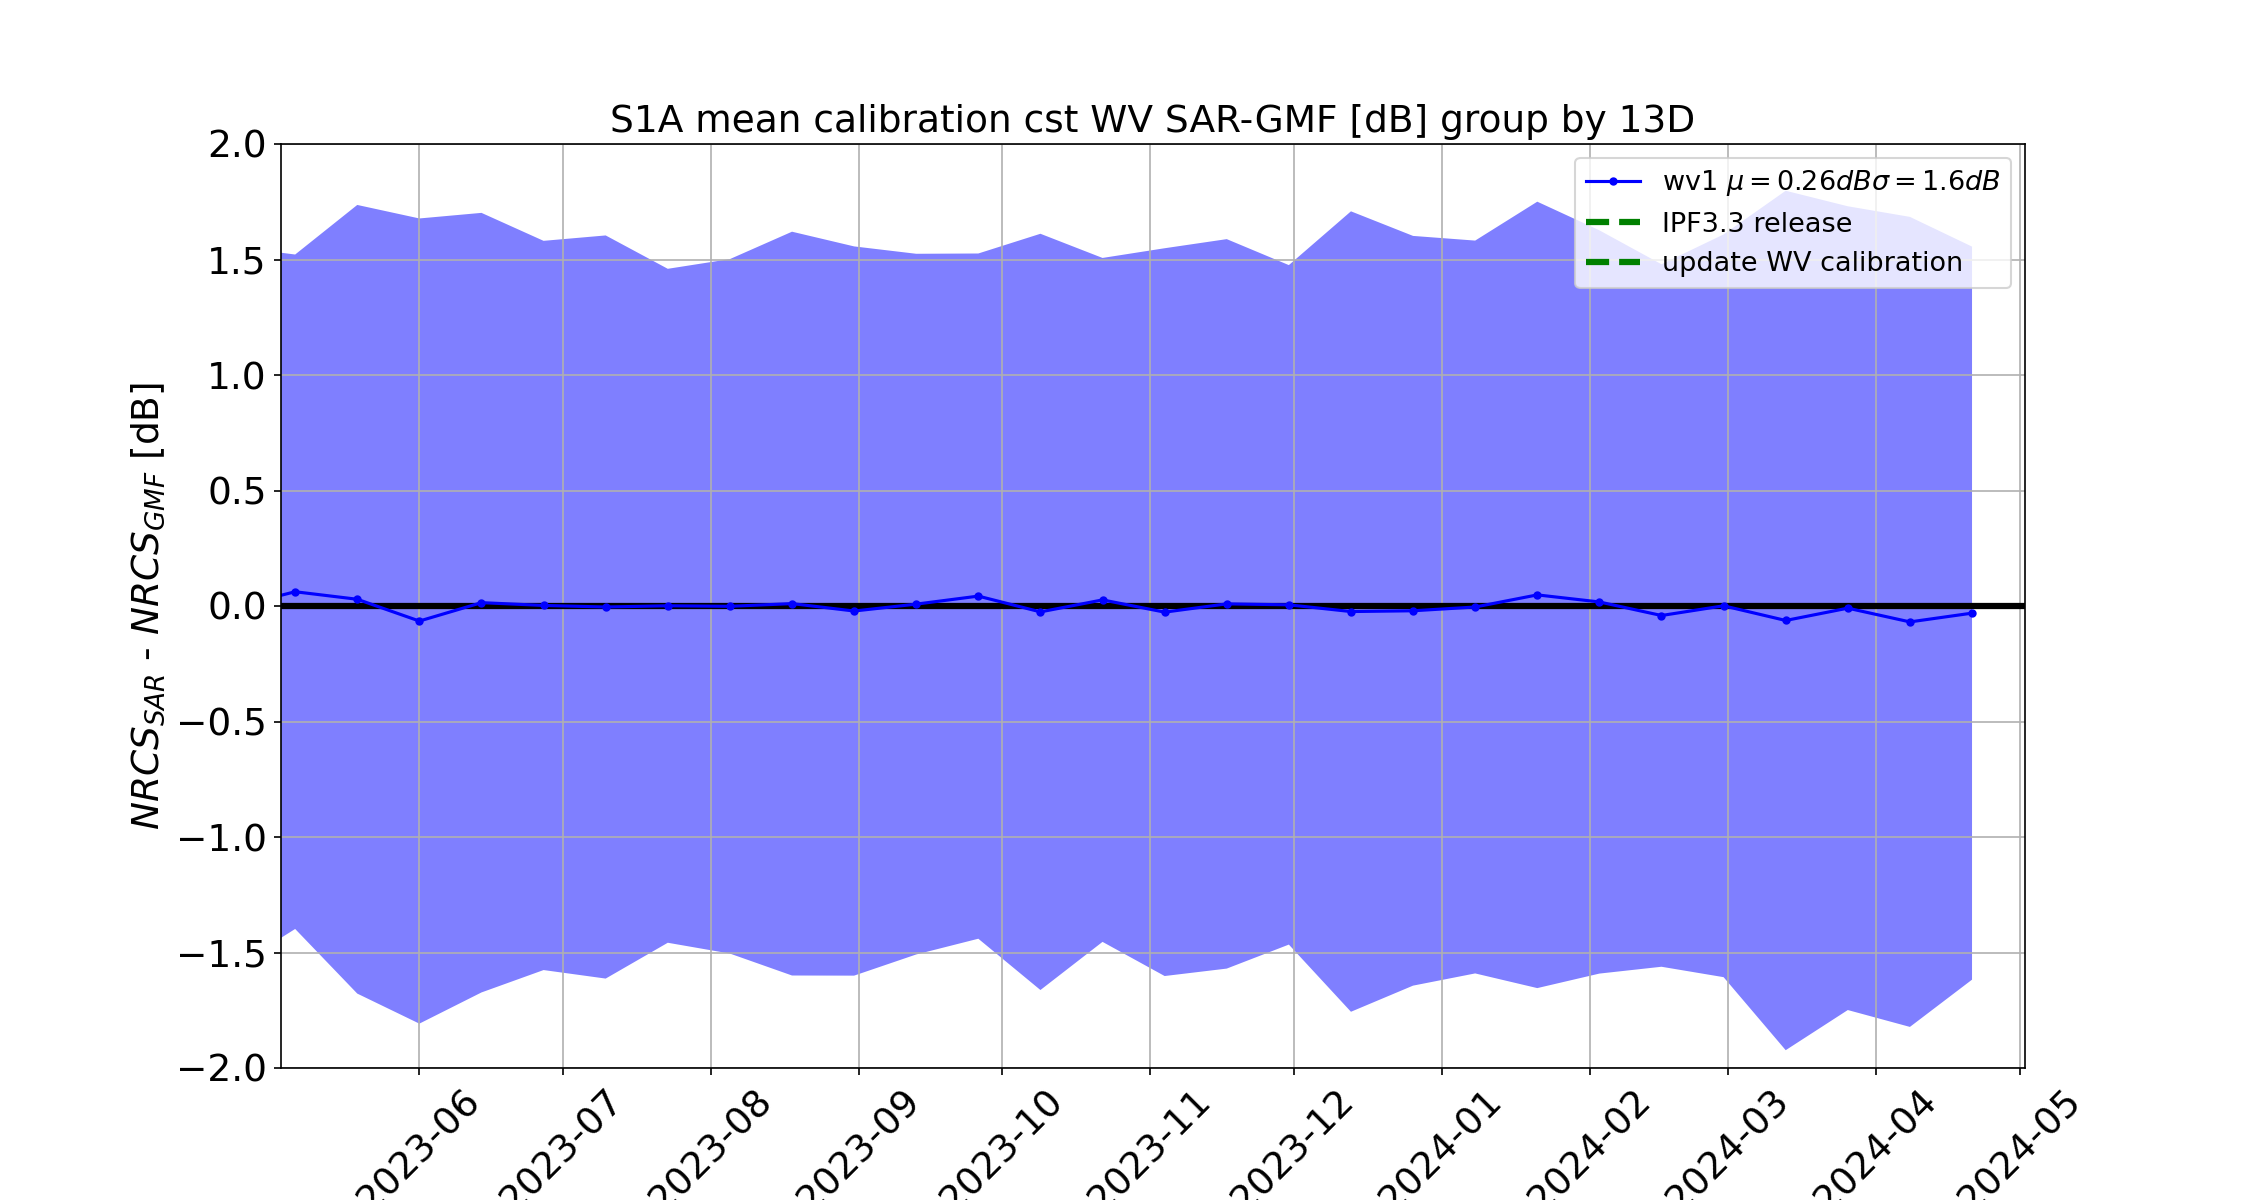
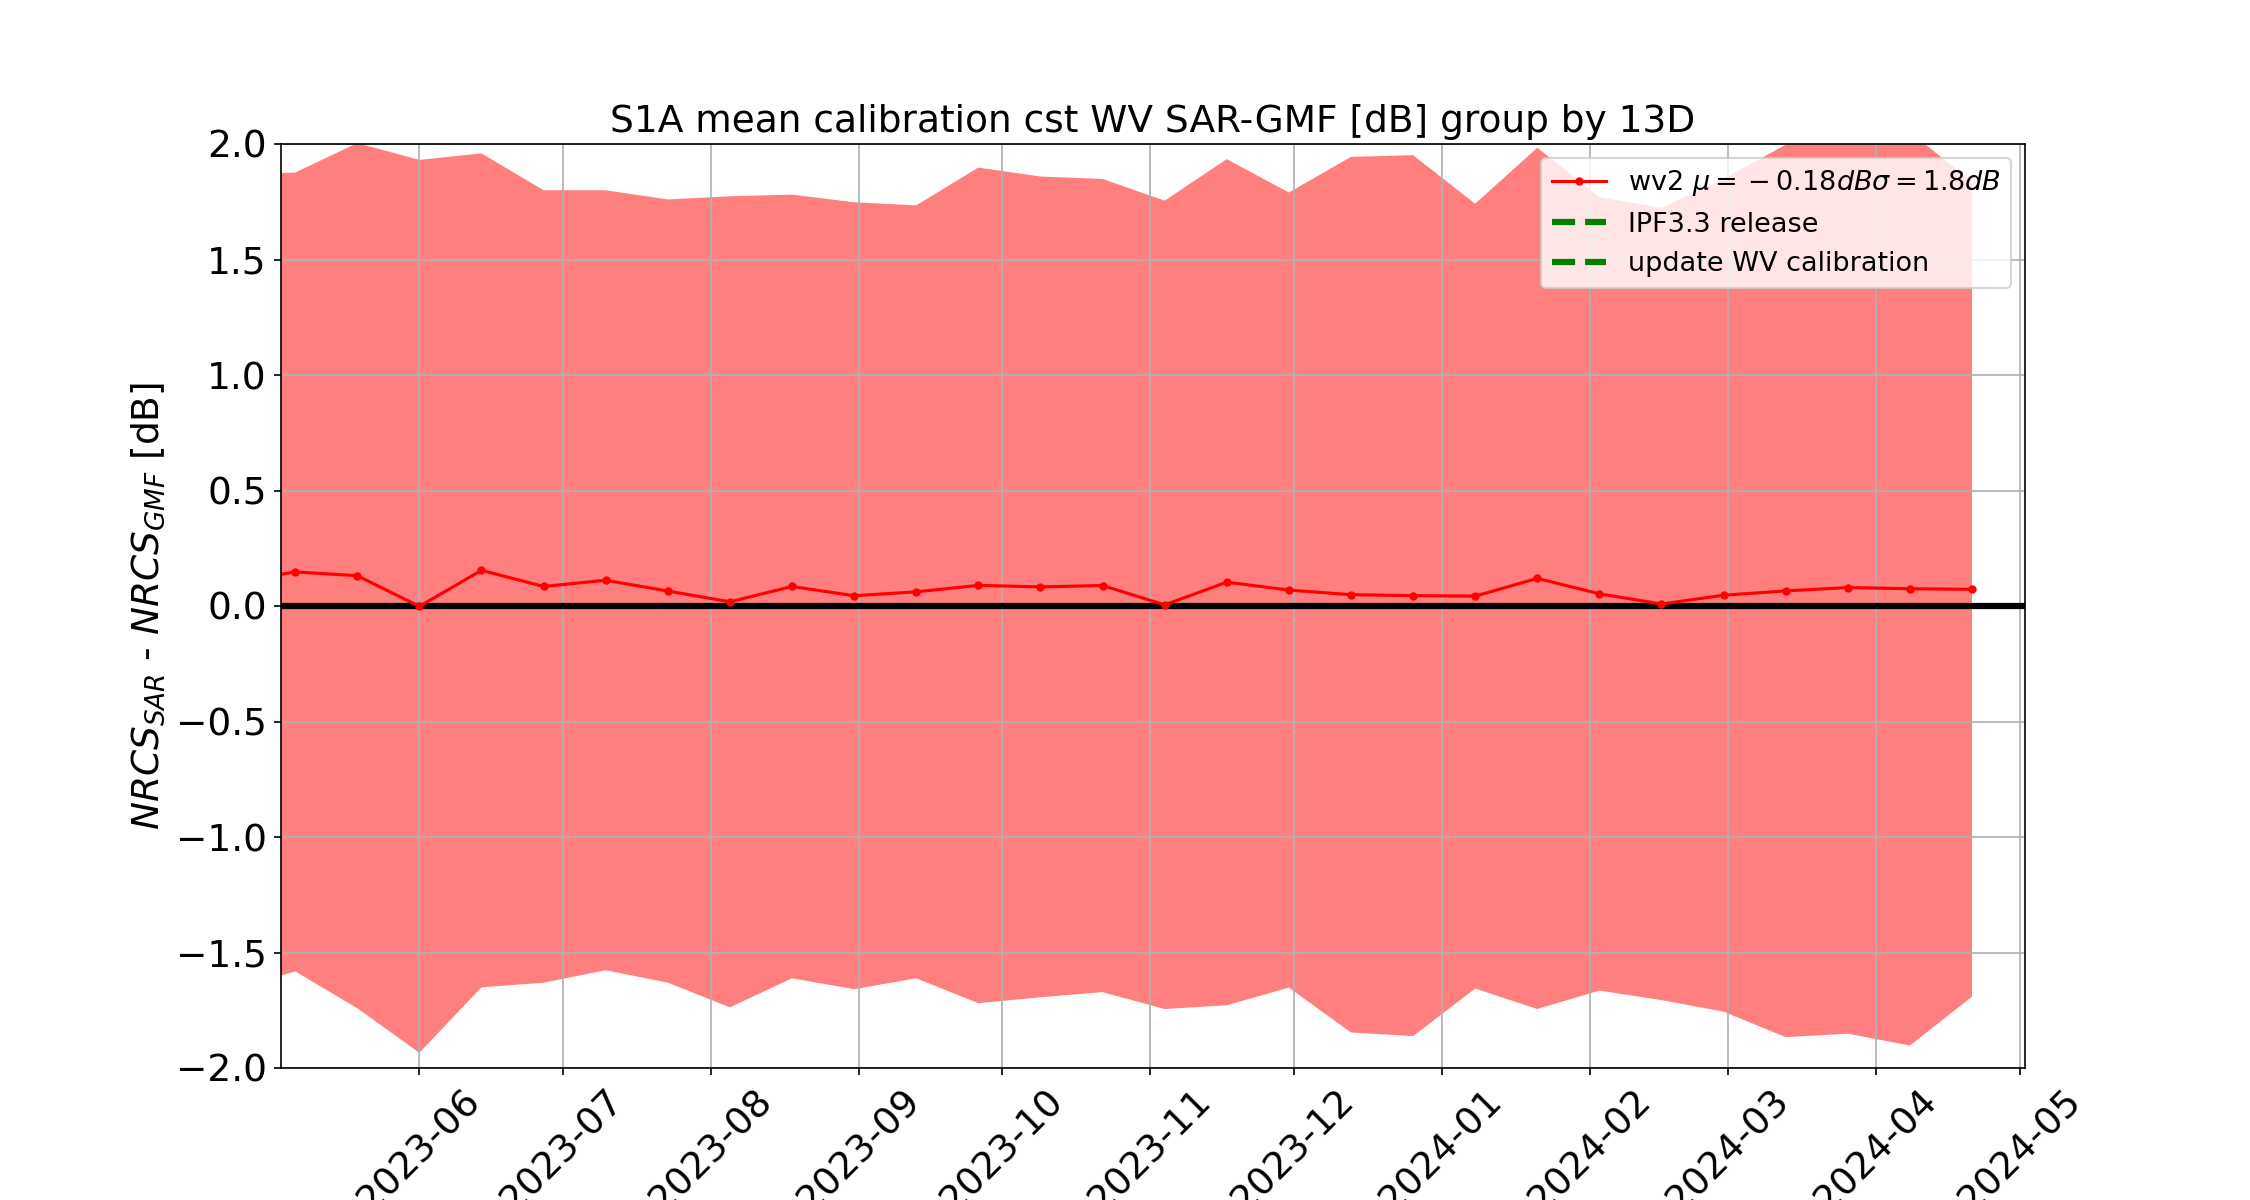
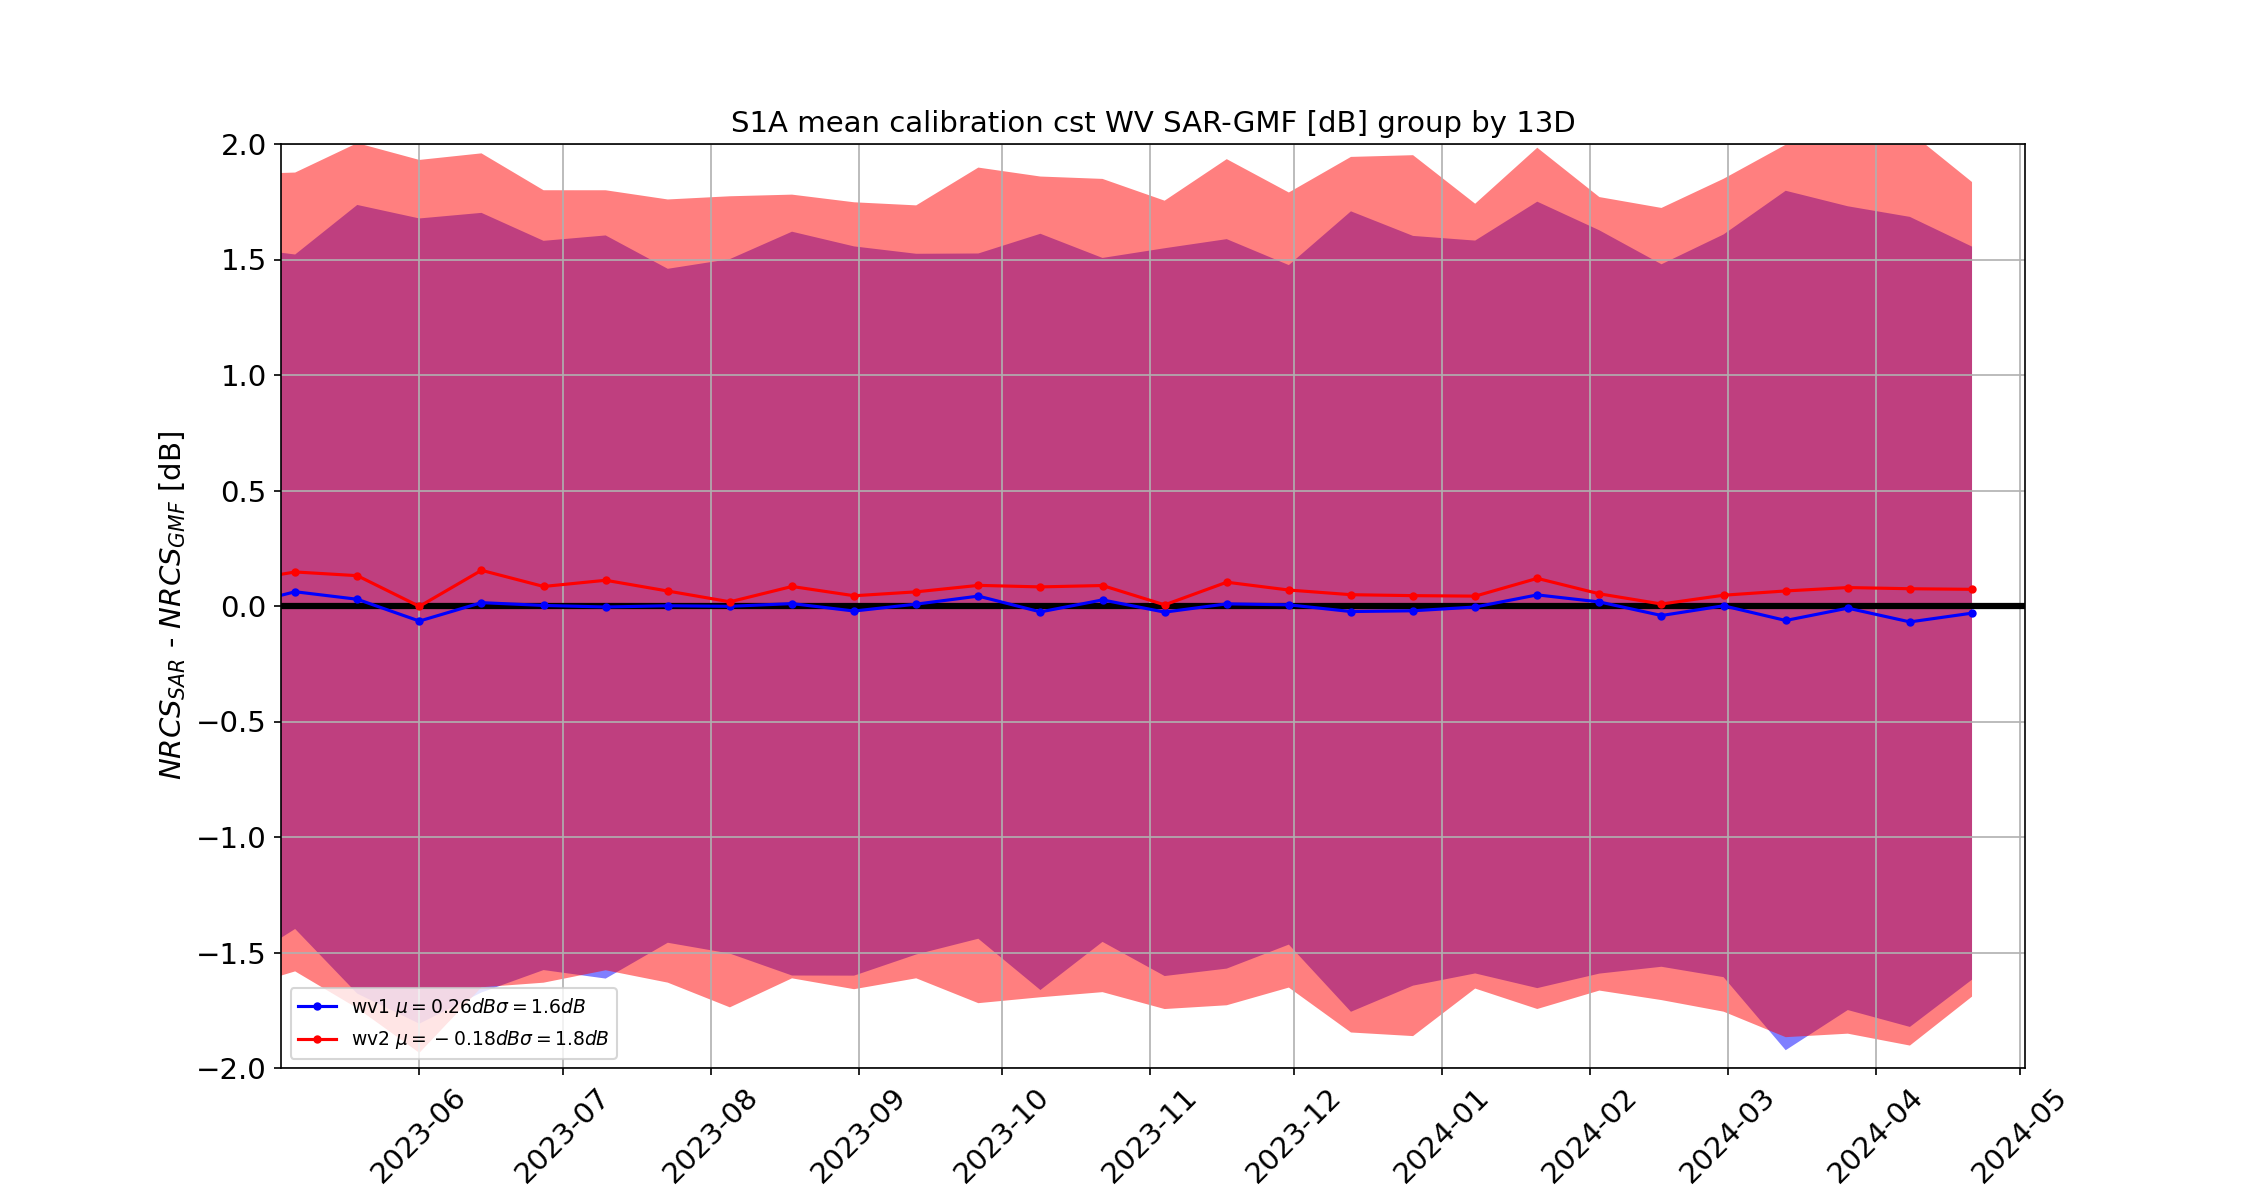
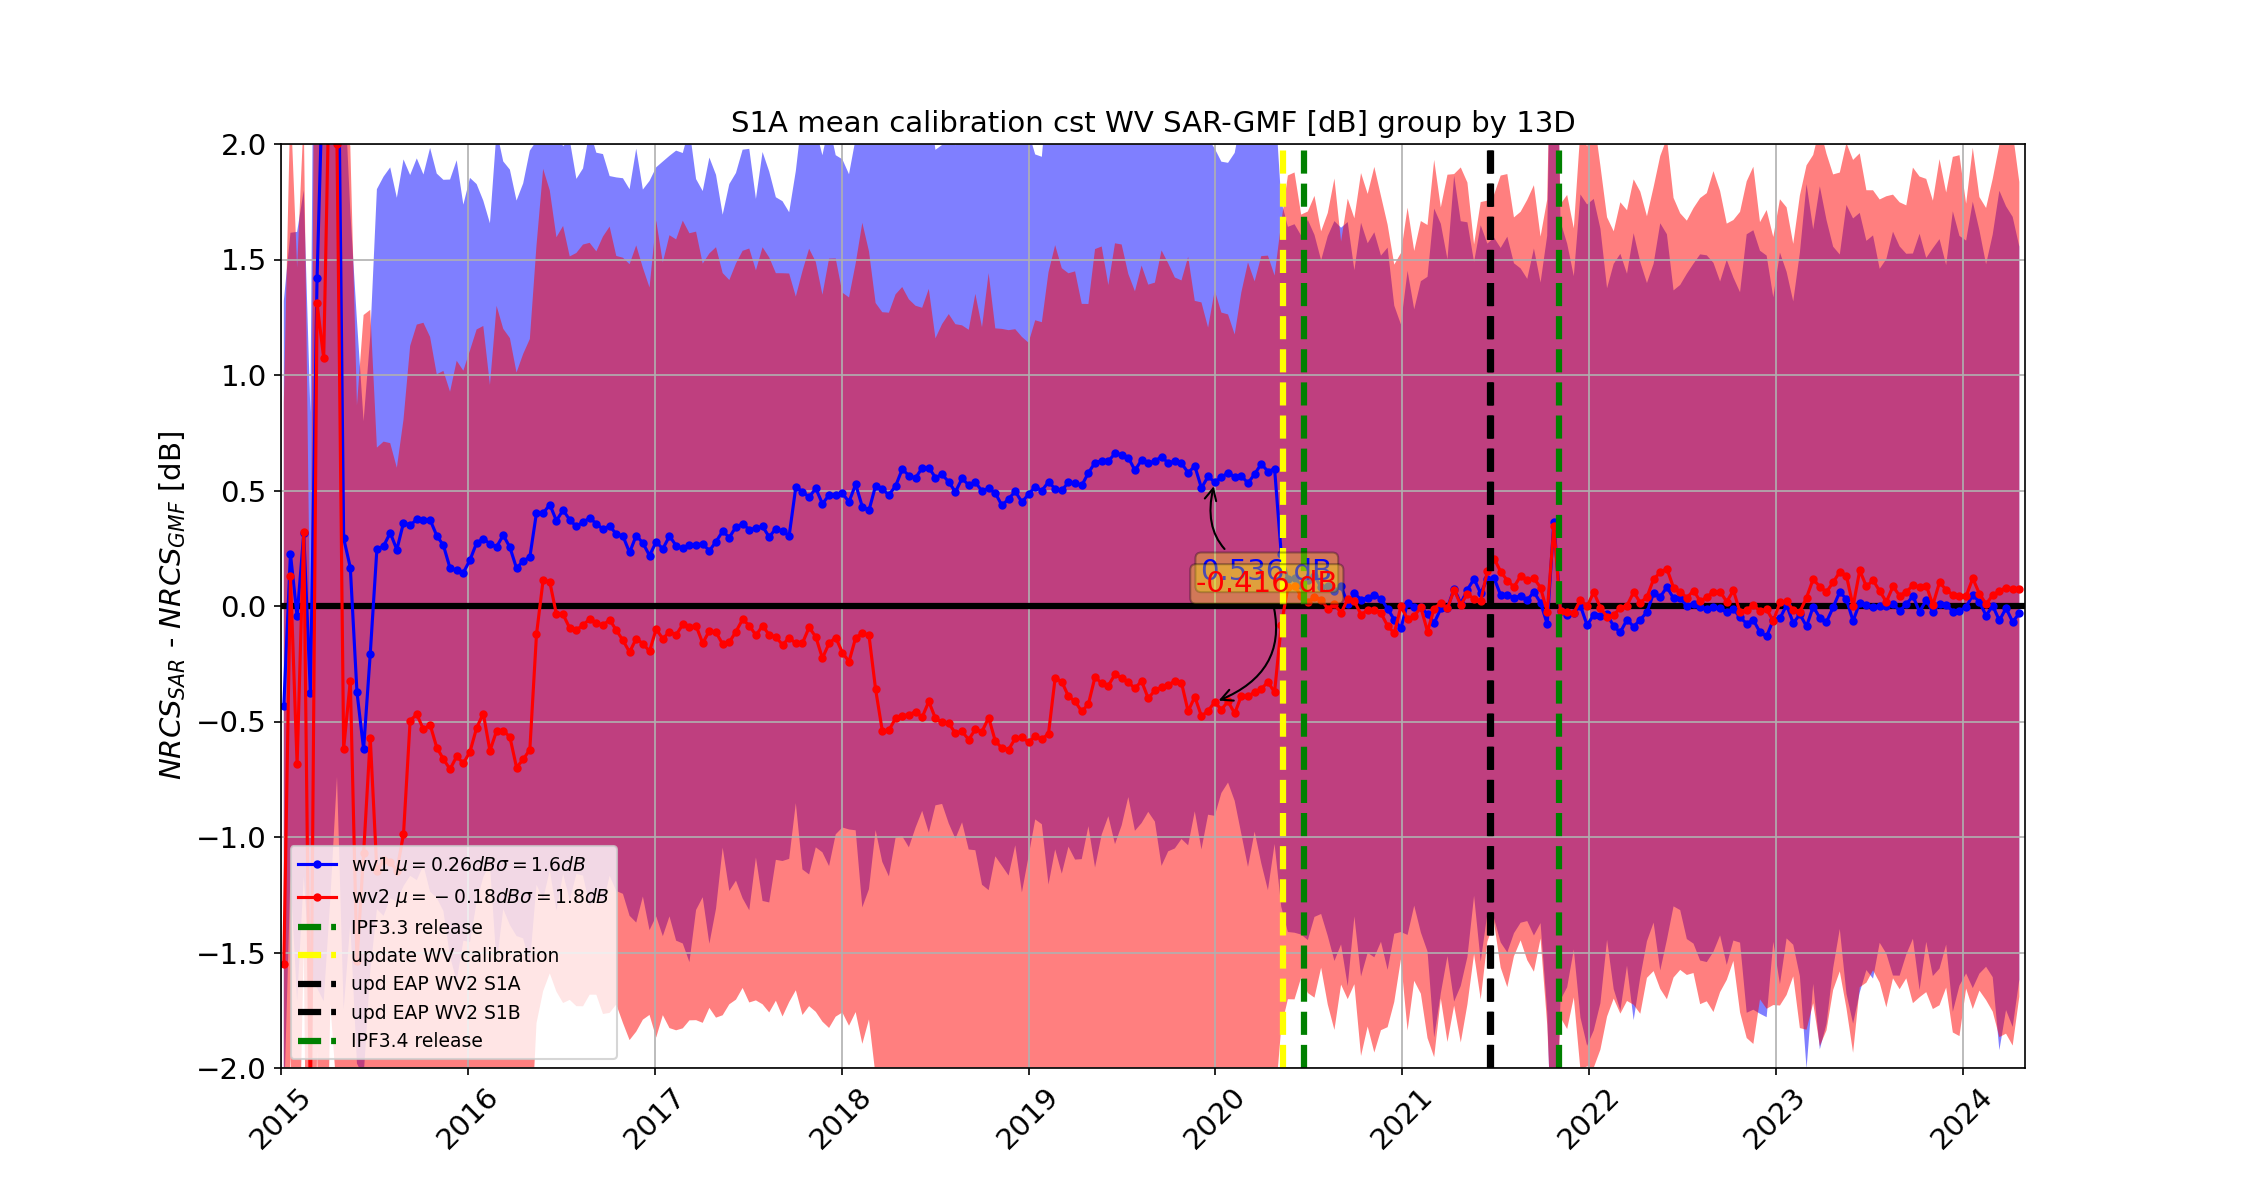
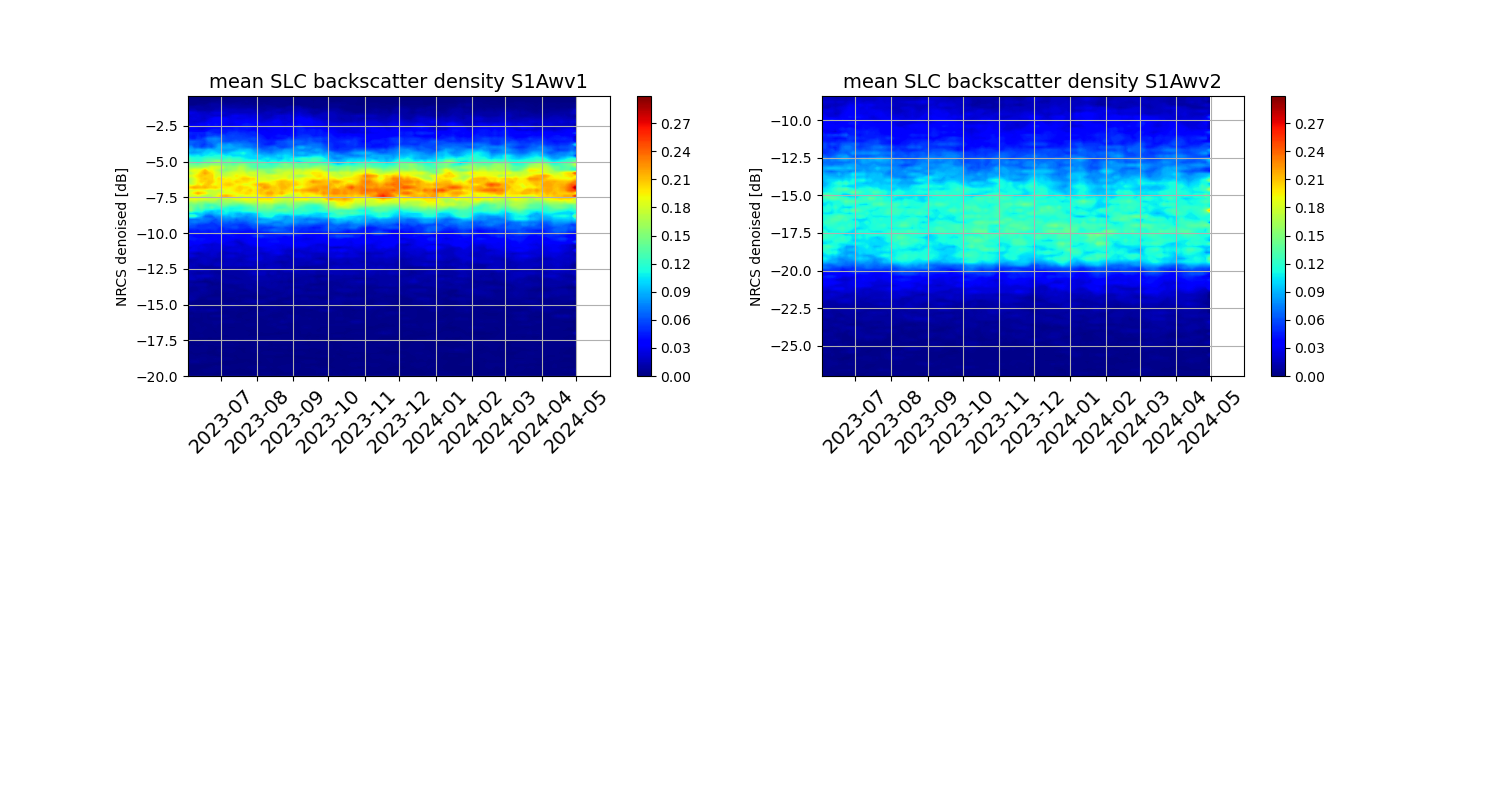
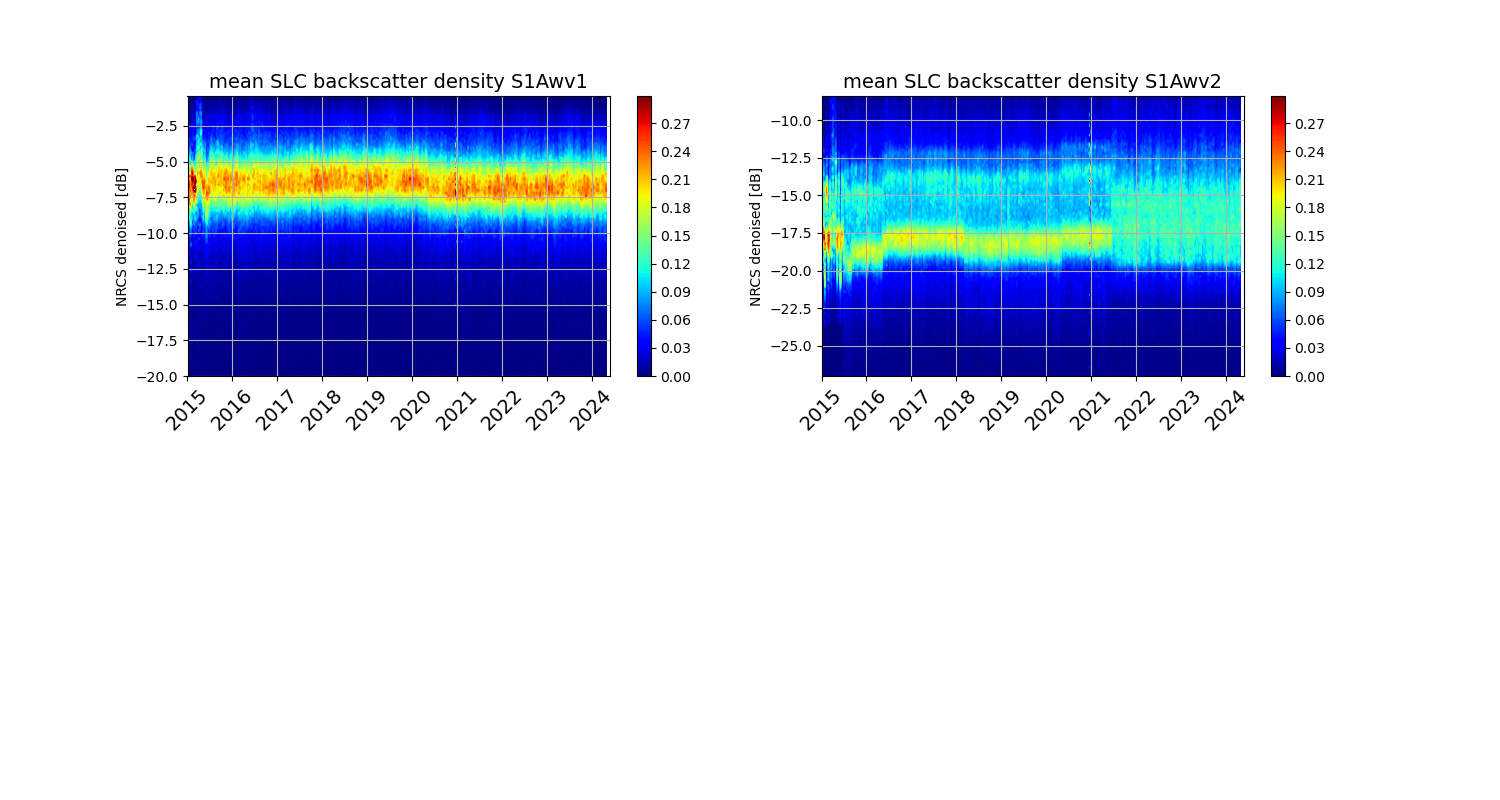
NRCS bias between model (CMOD based) and SAR observations. NRCS from SAR are denoised using annotated noise vectors.
Last 365 days
Full mission
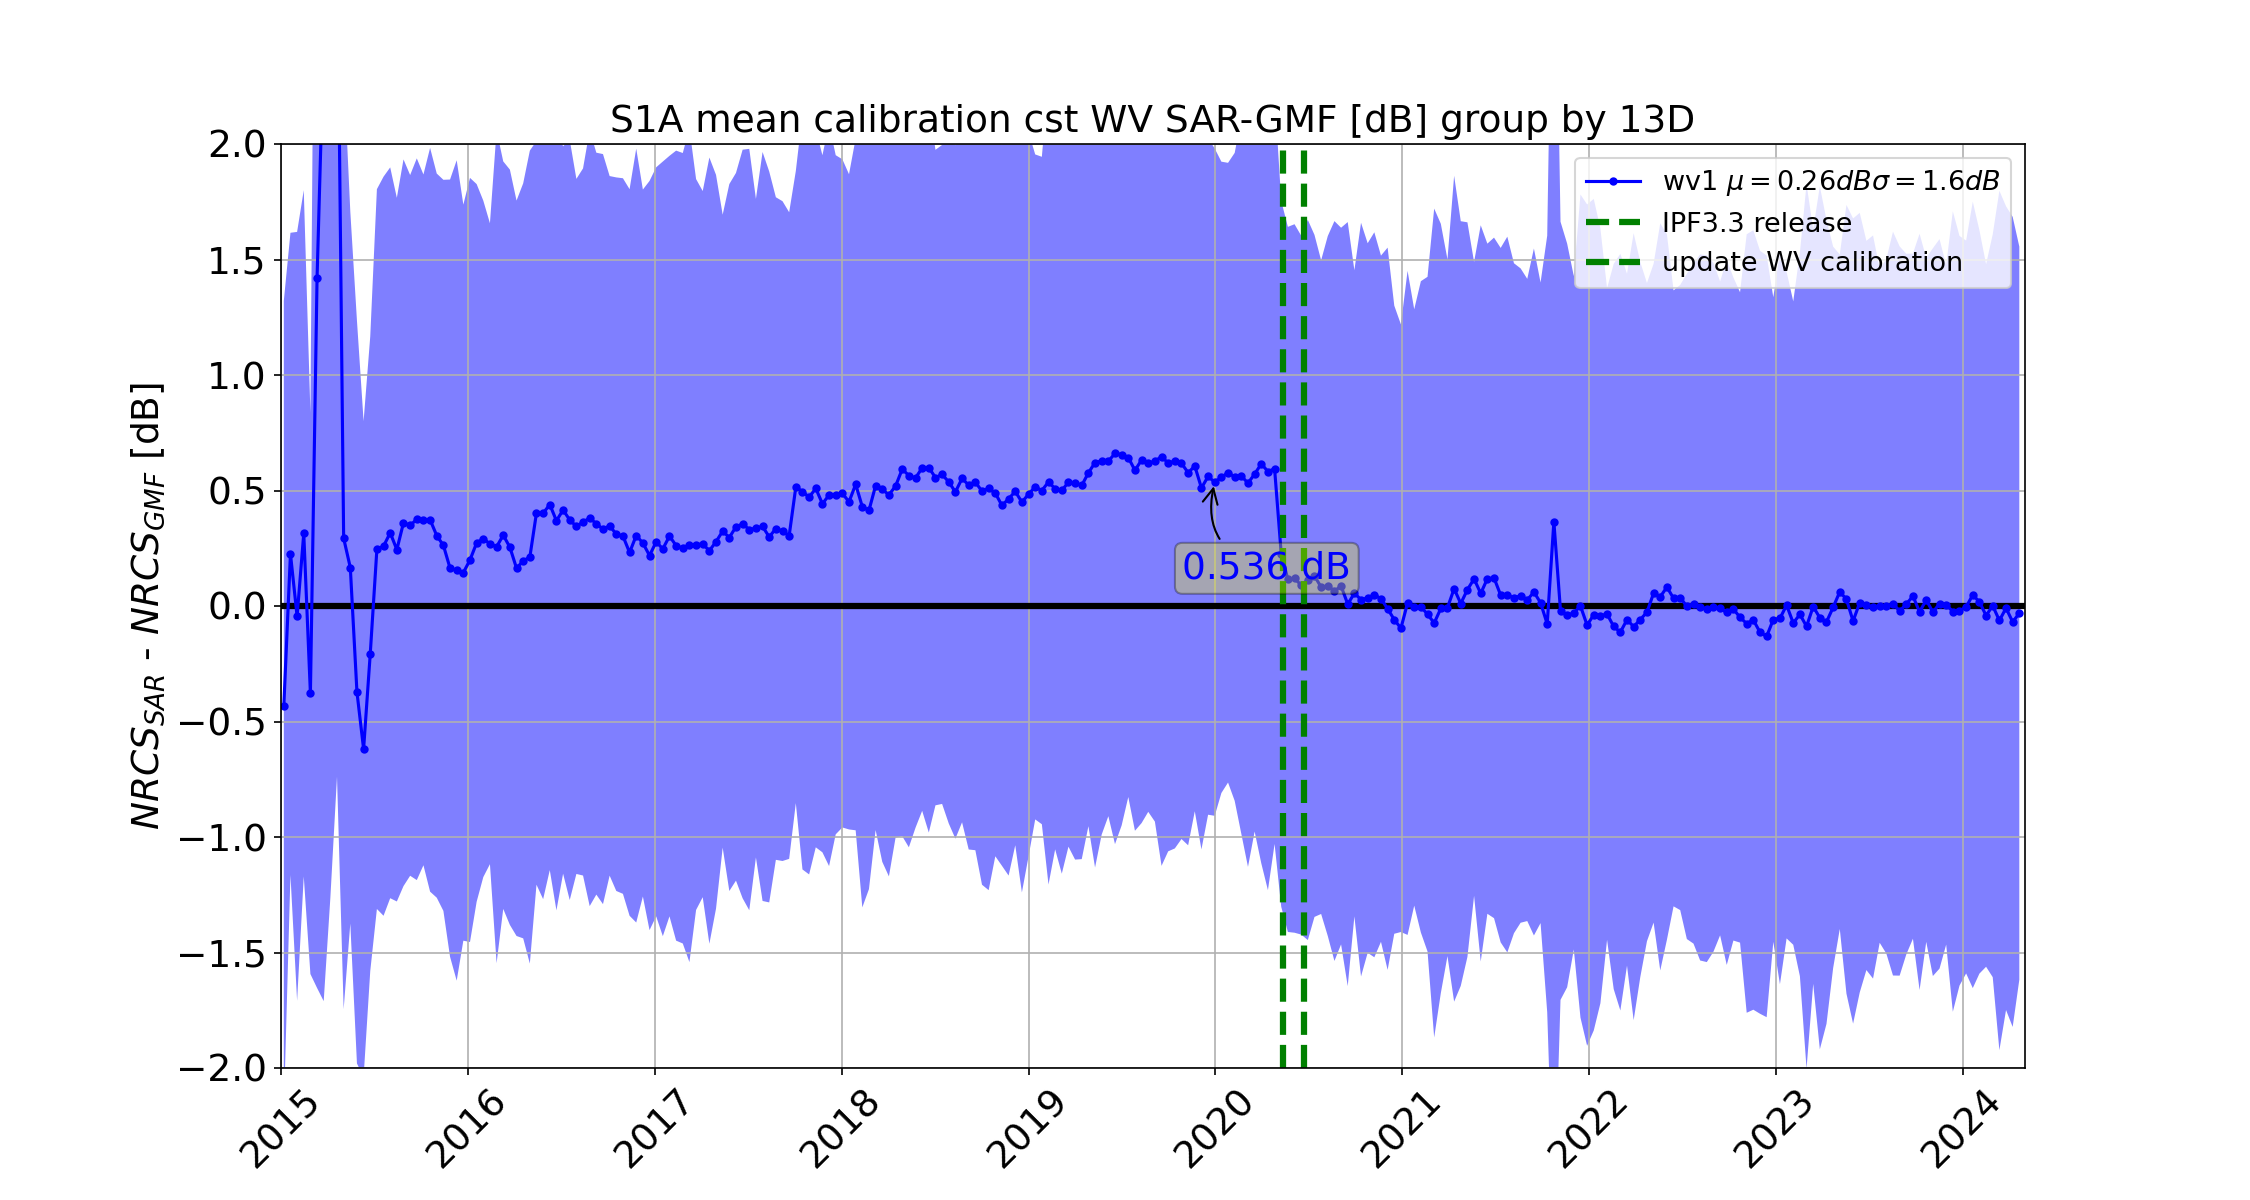
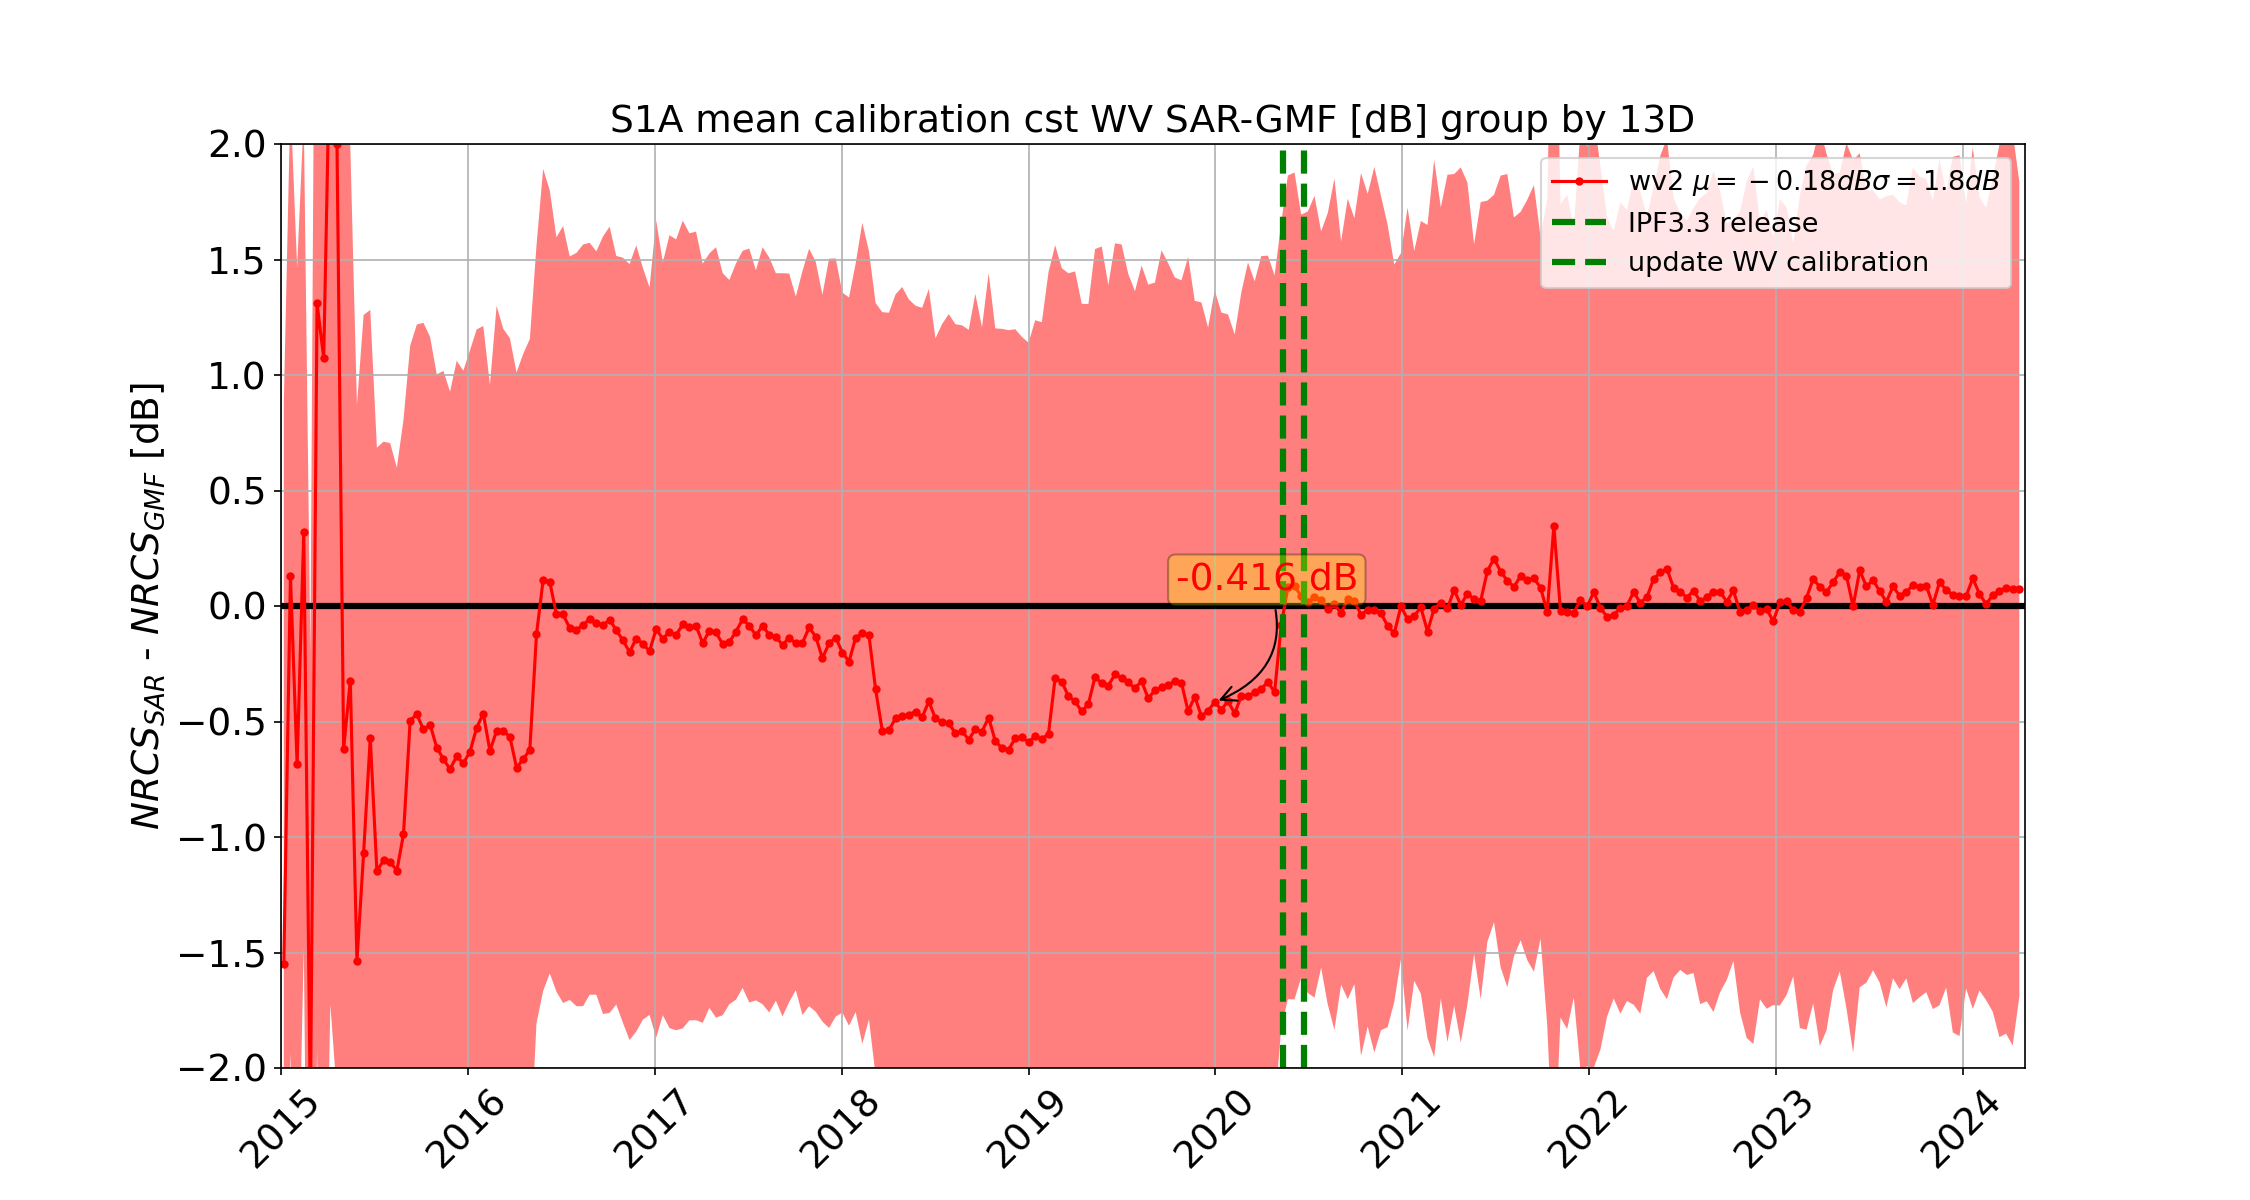
WV1 and WV2 superimposed for the last 365 days (left) and for the whole mission (right).
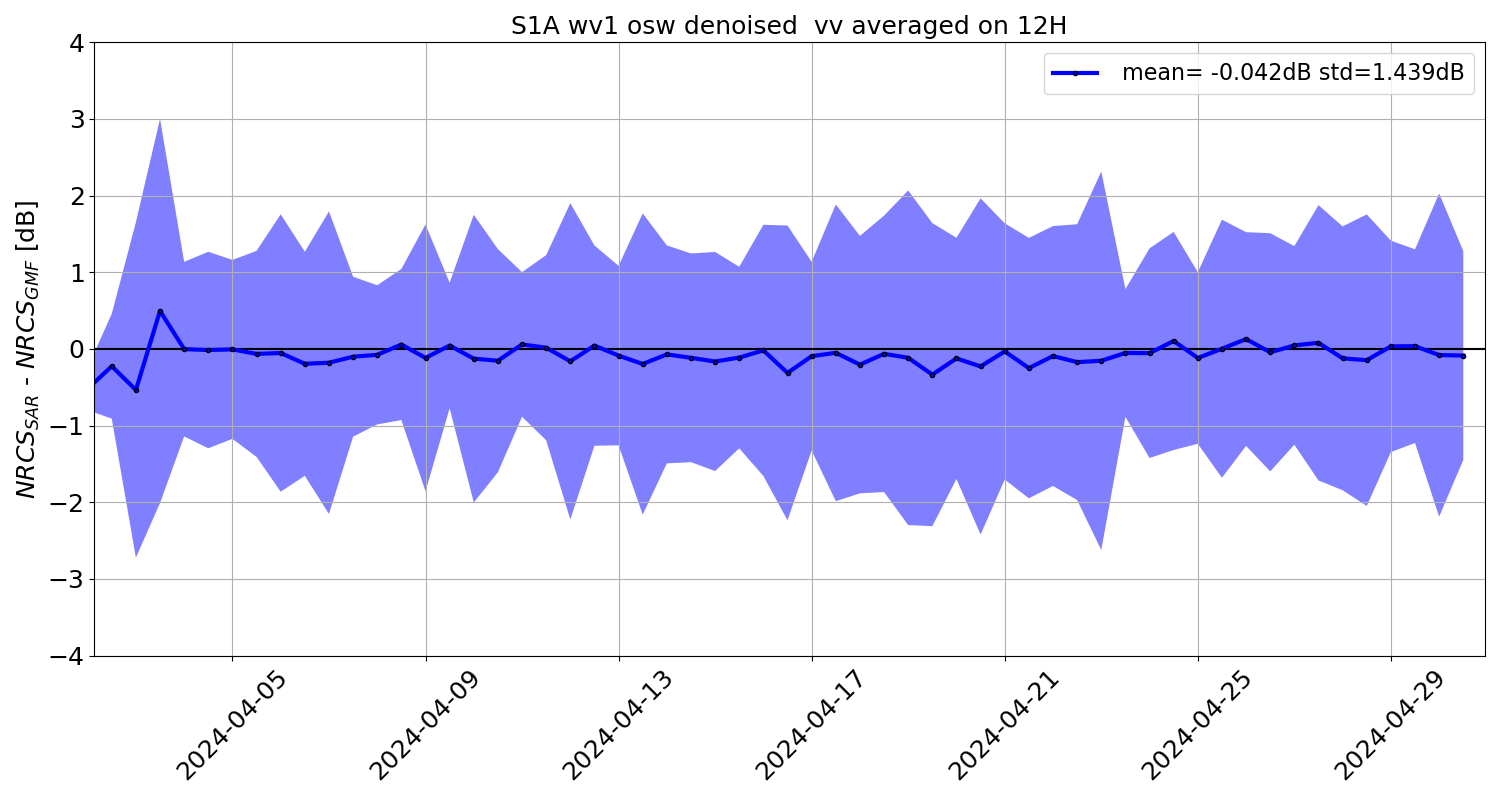
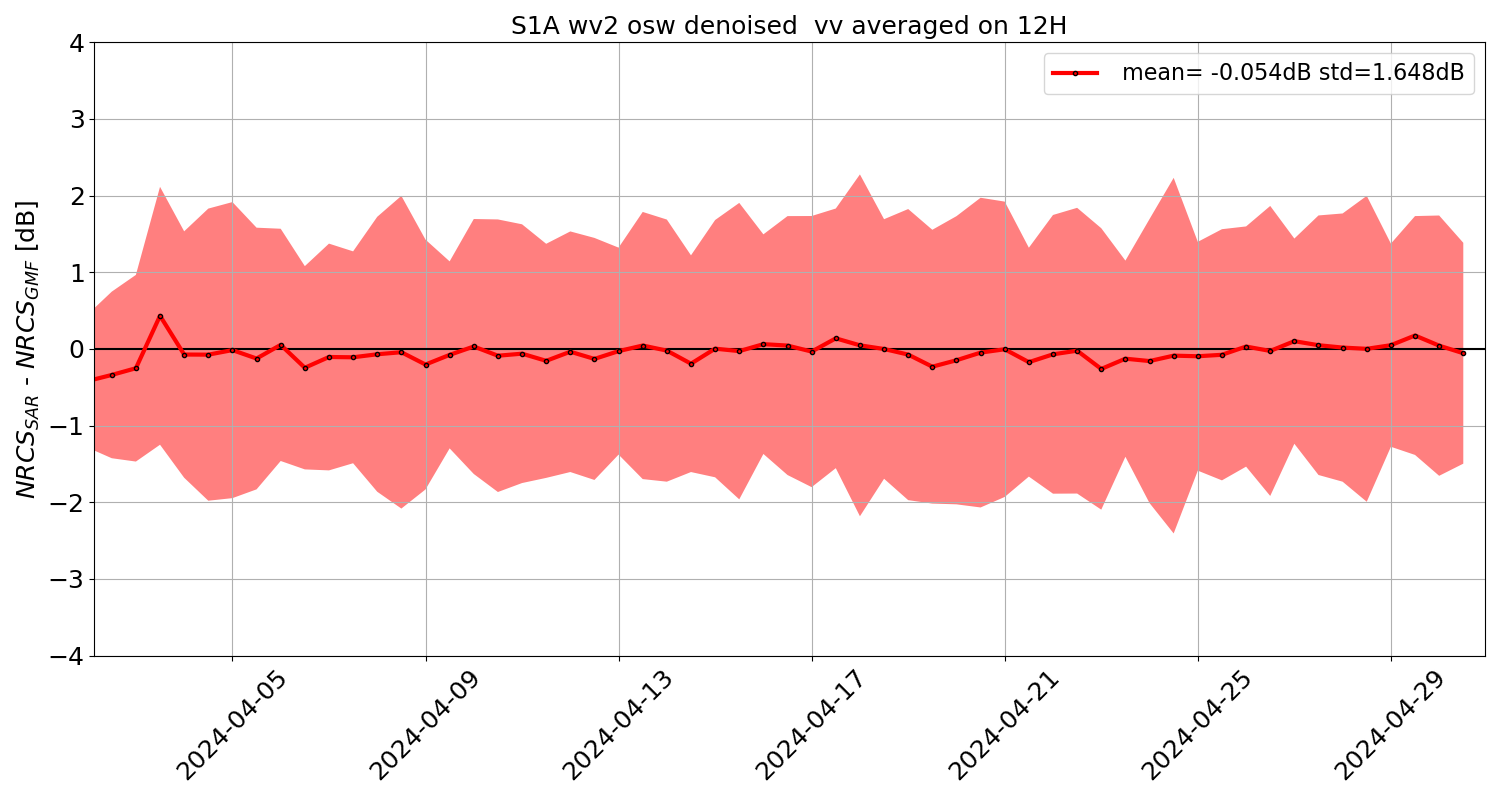
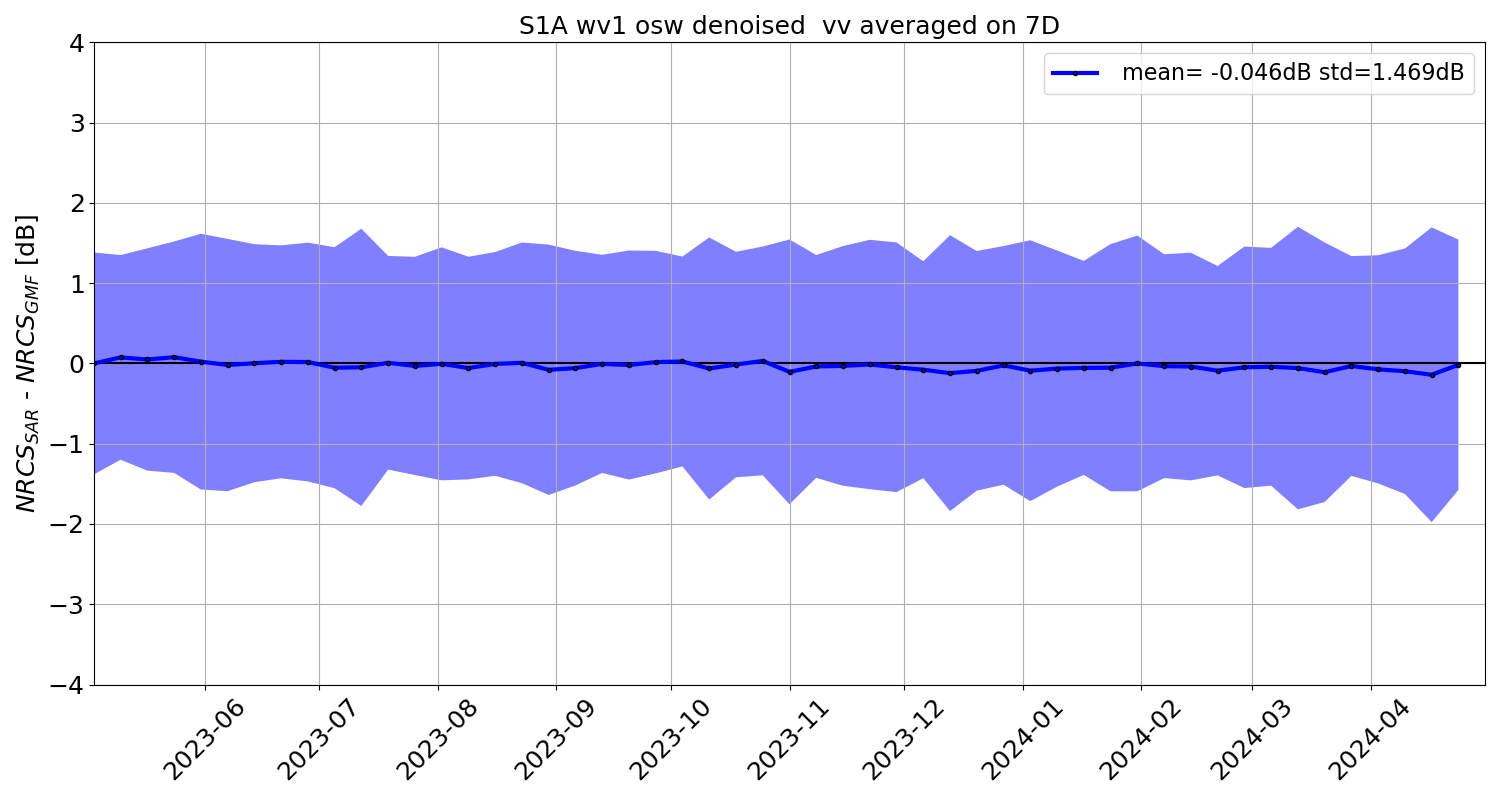
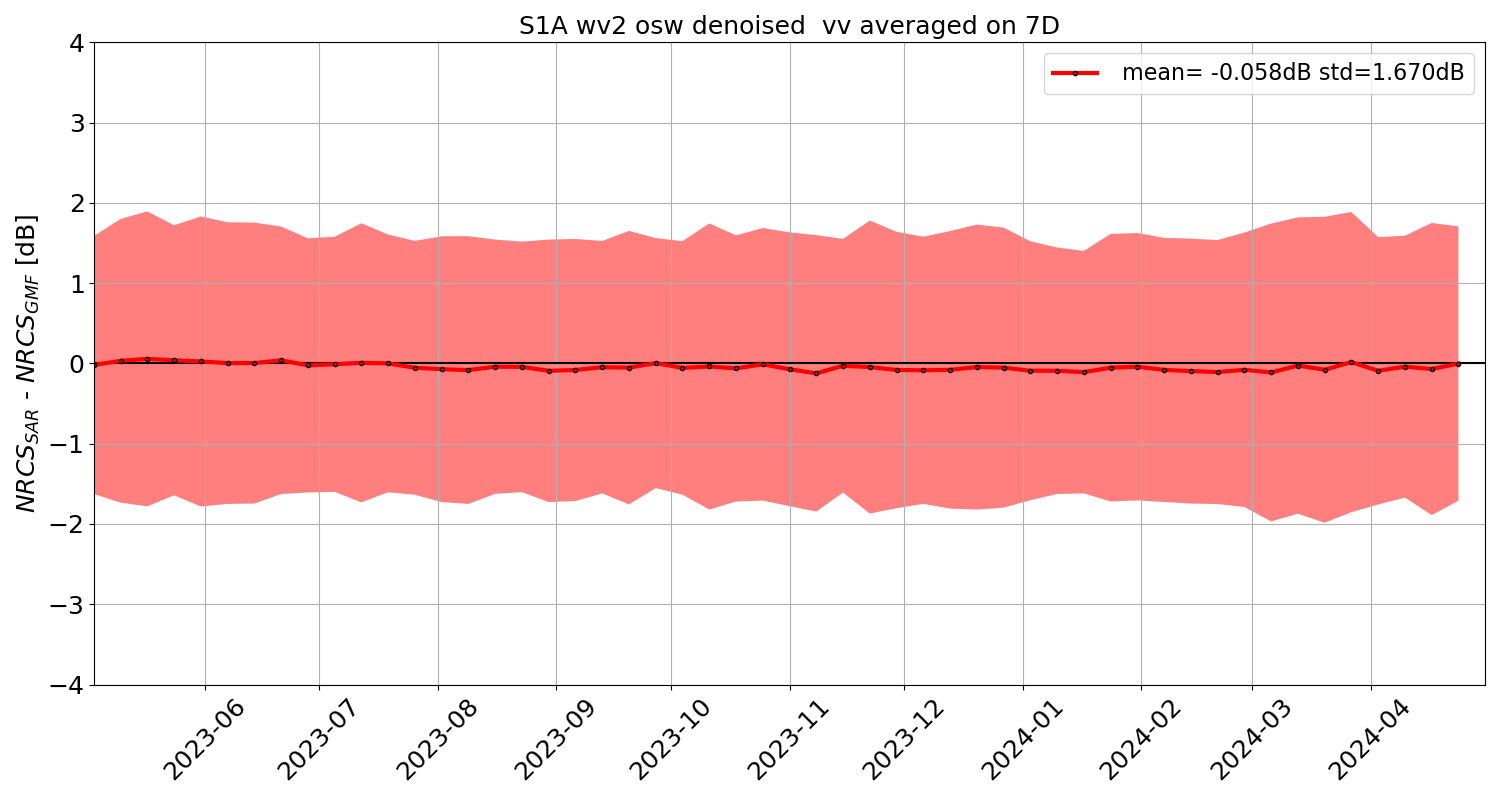
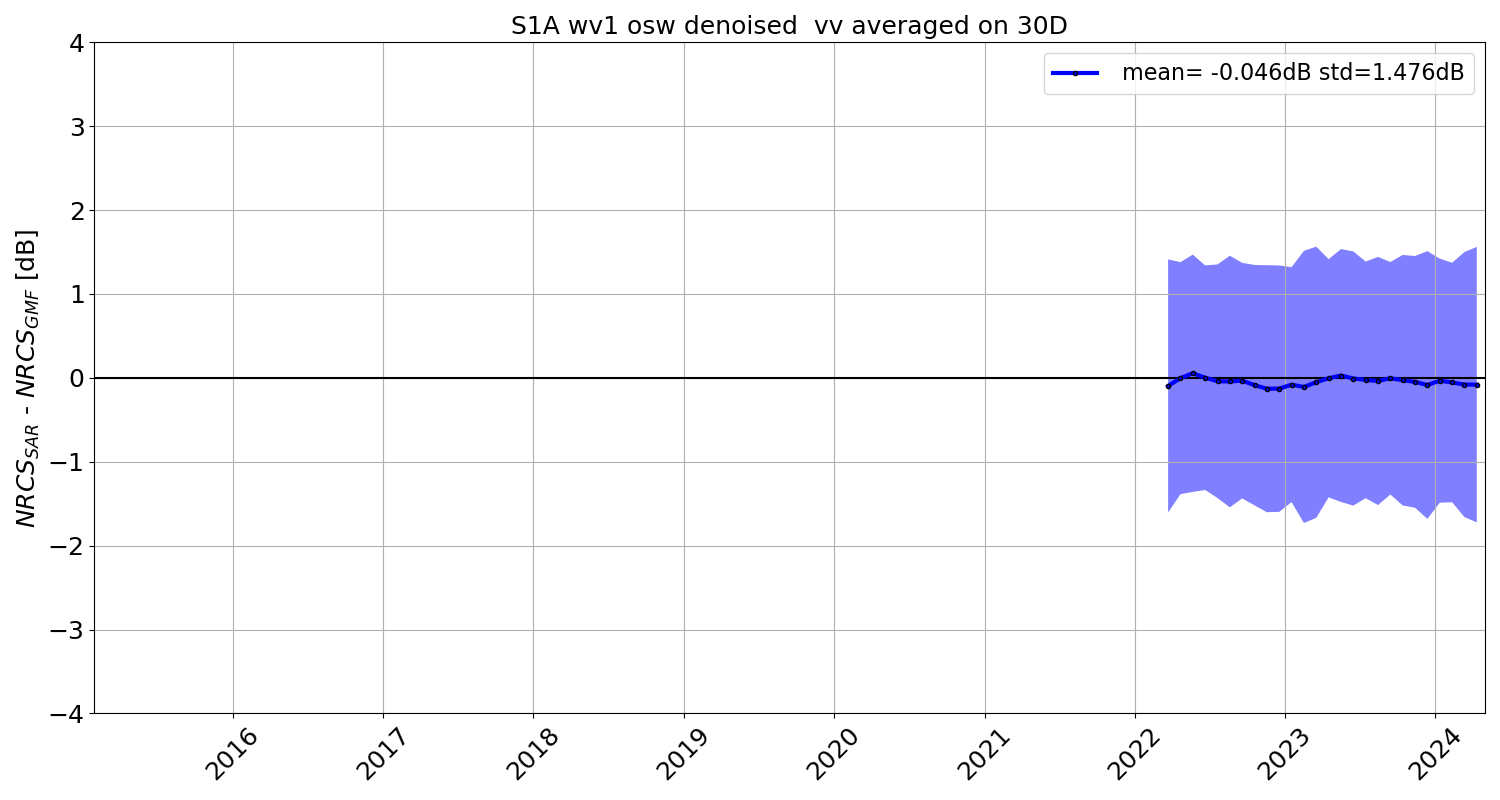
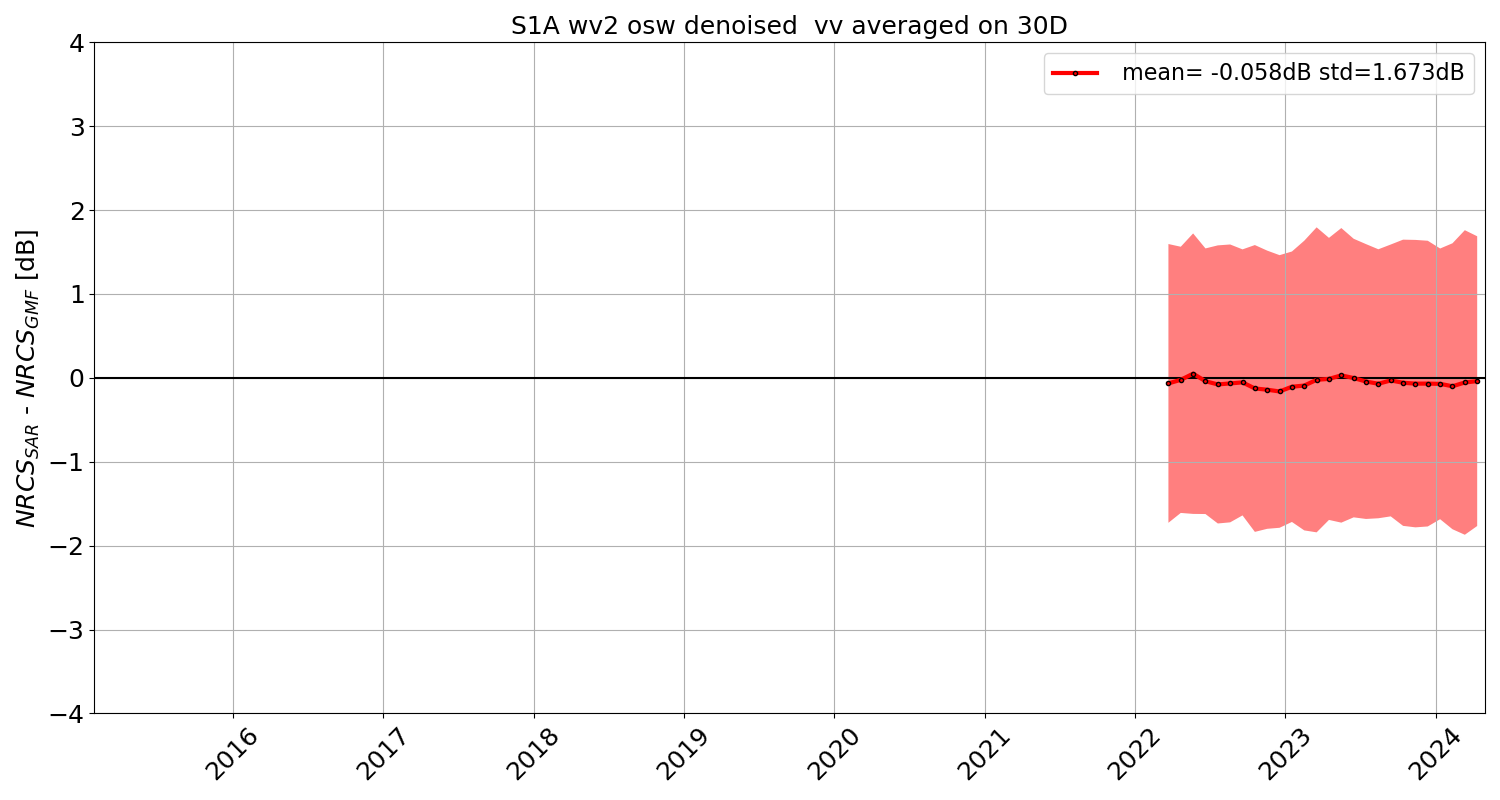
1.2 WV NRCS OCN Level-2 products
1.2.1 OSW component
Current Year
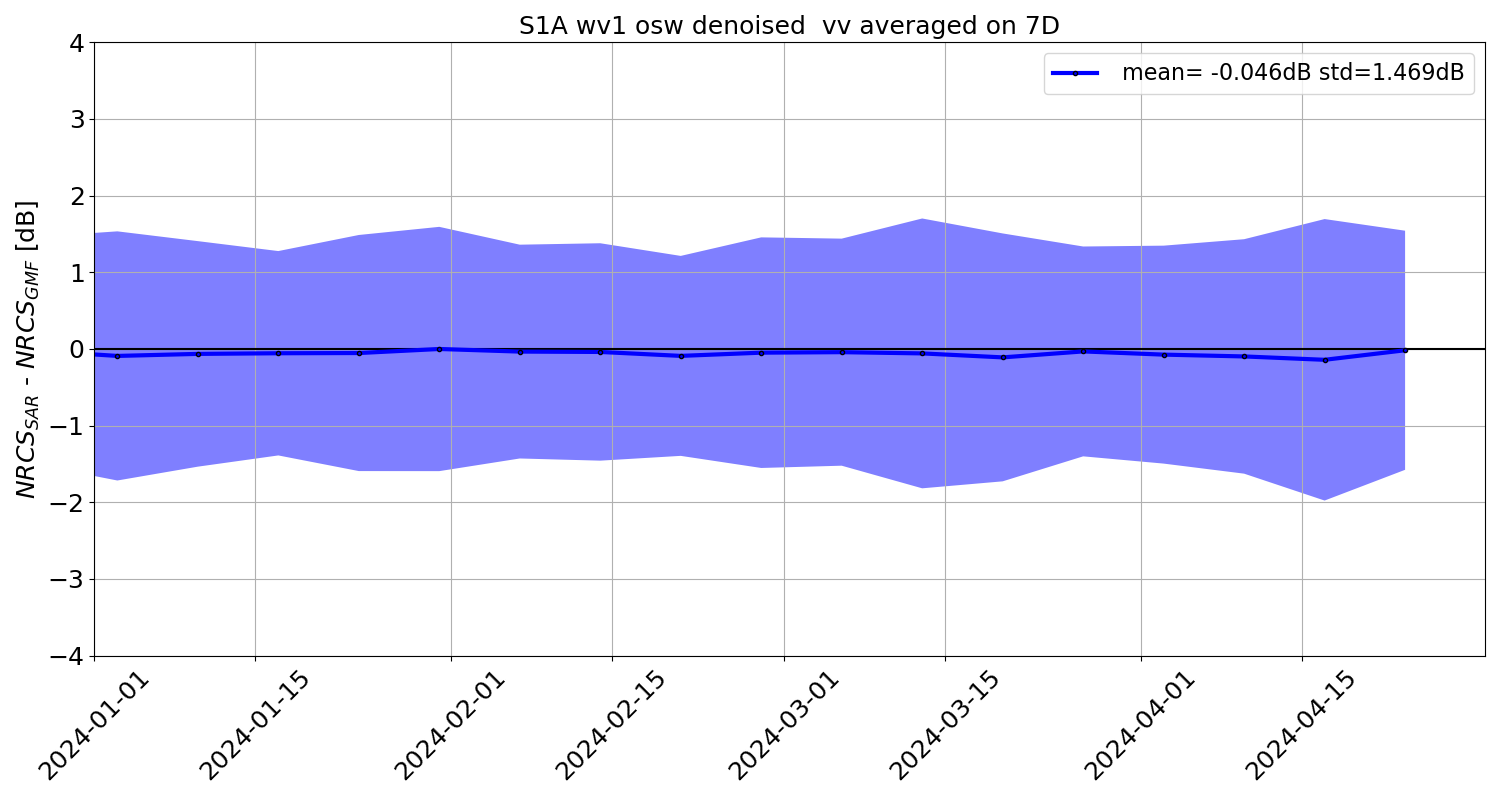
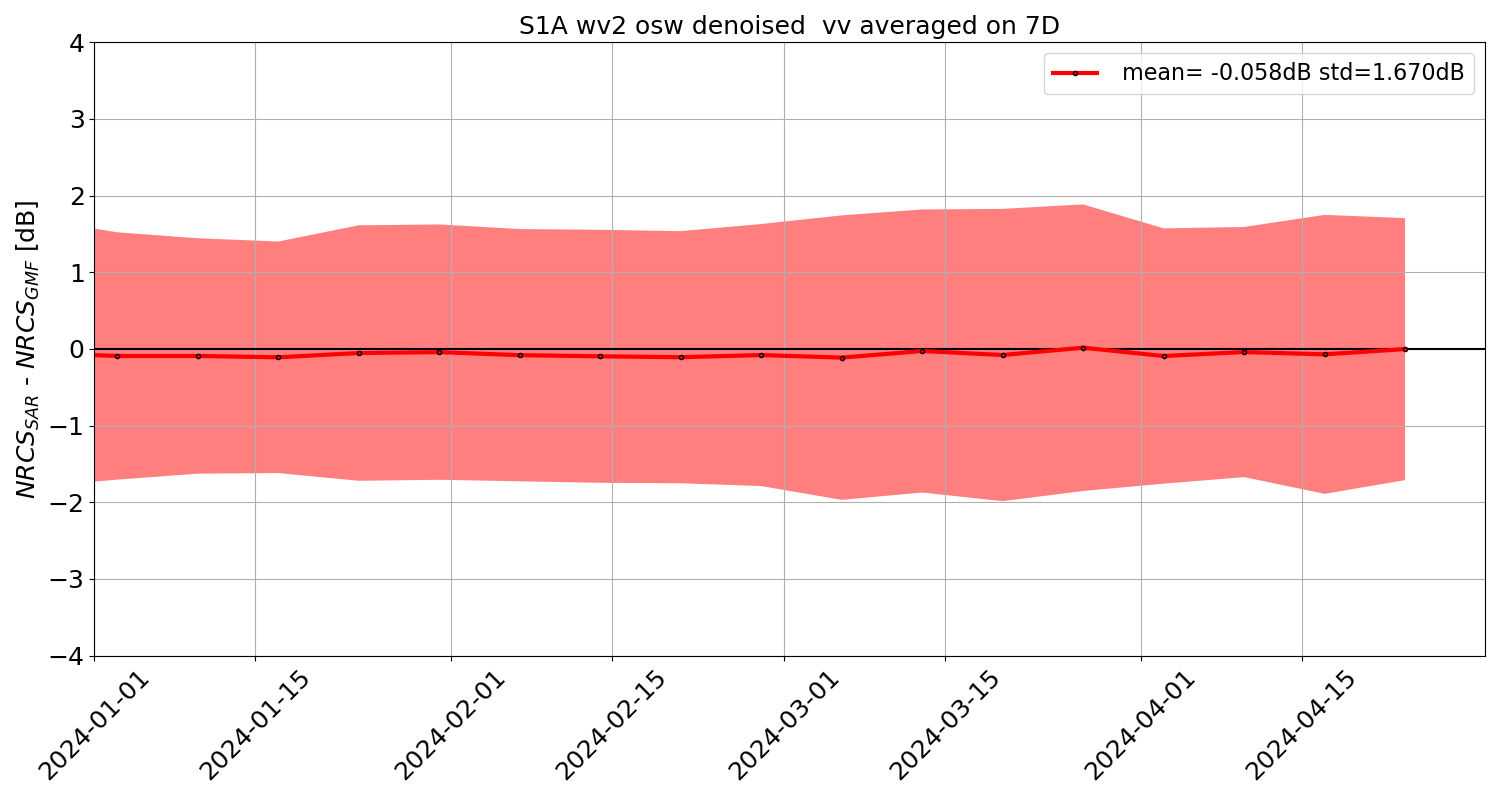
Last 30 days
Last 365 days
Full mission
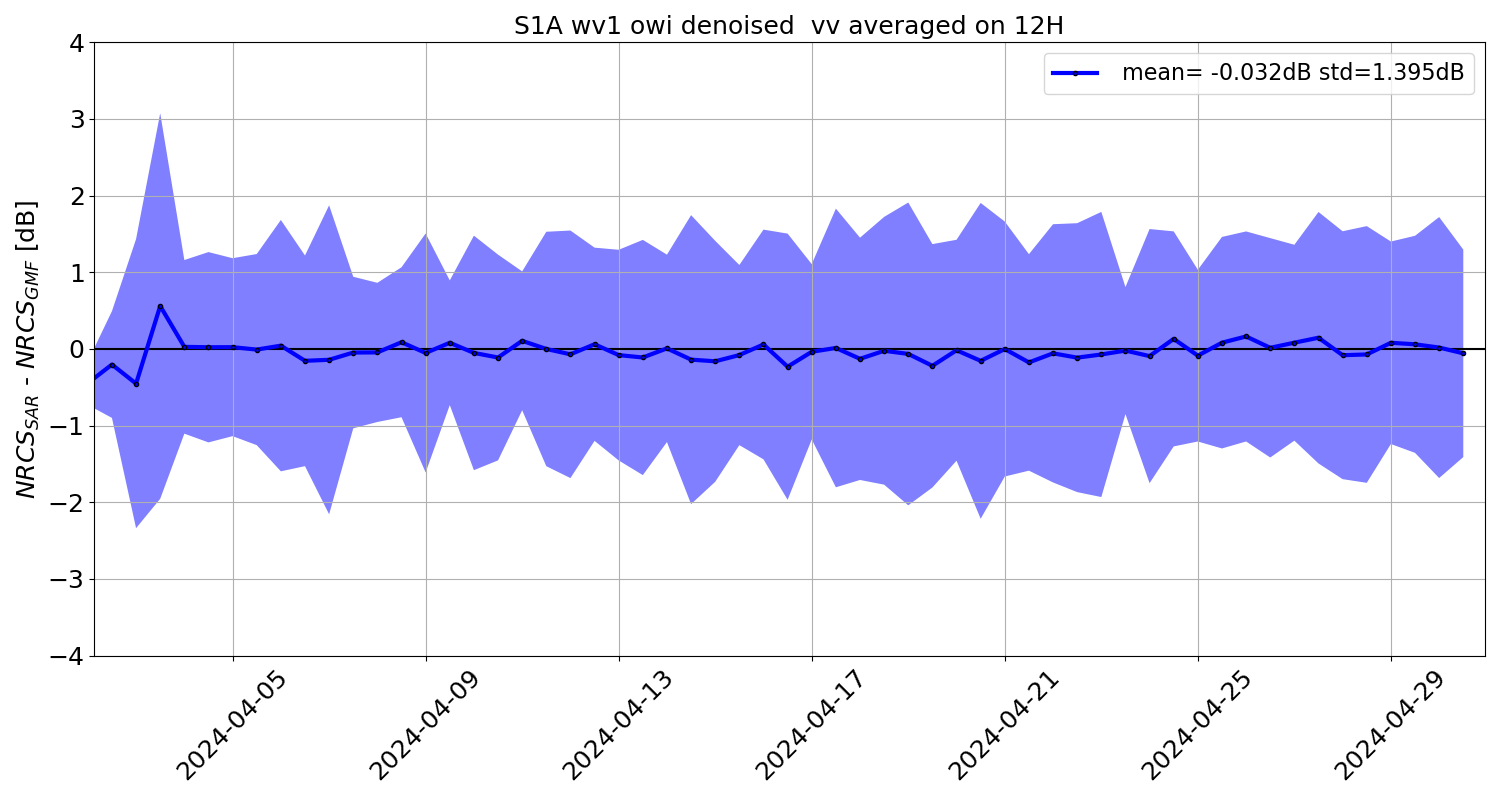
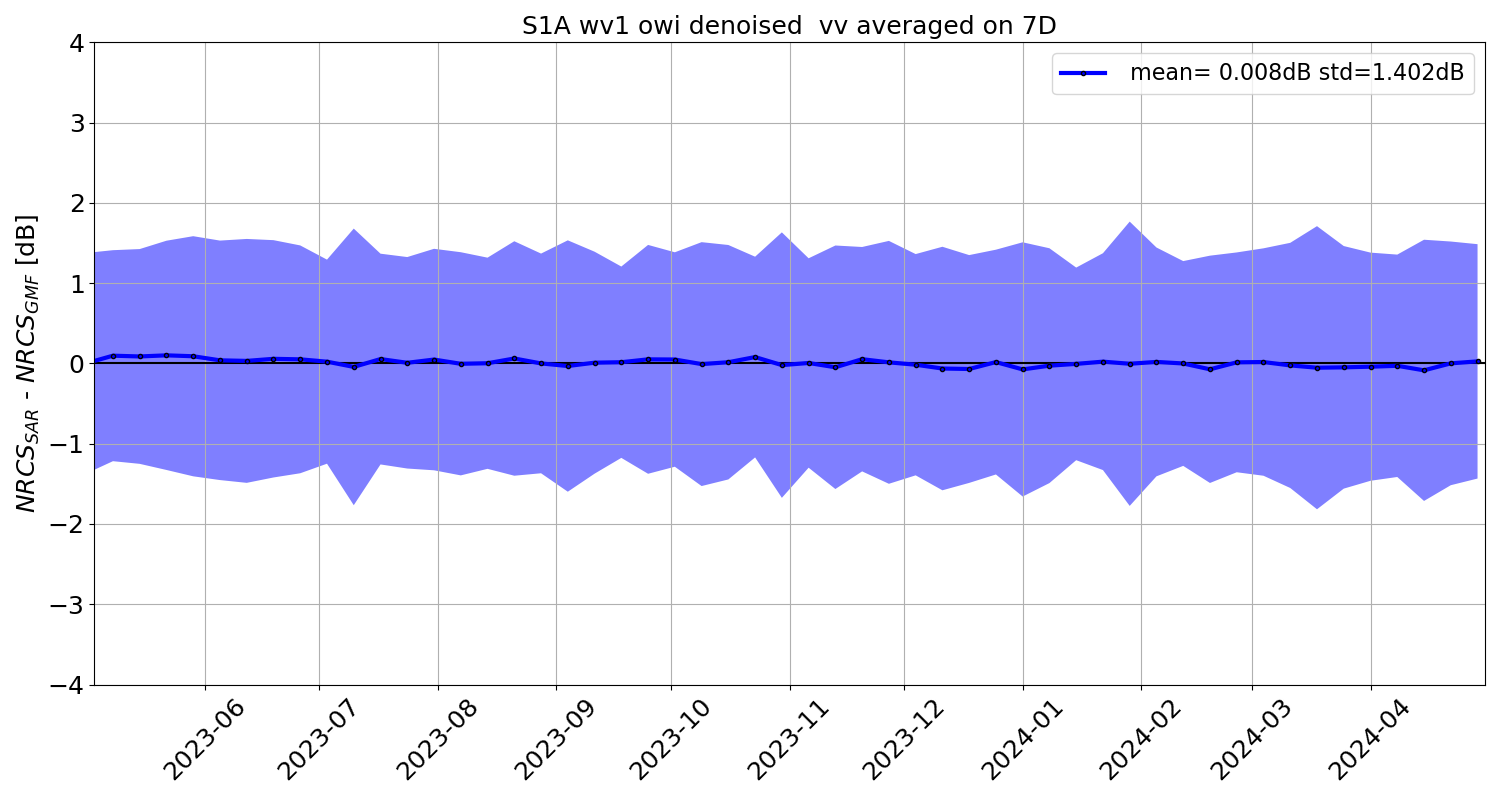
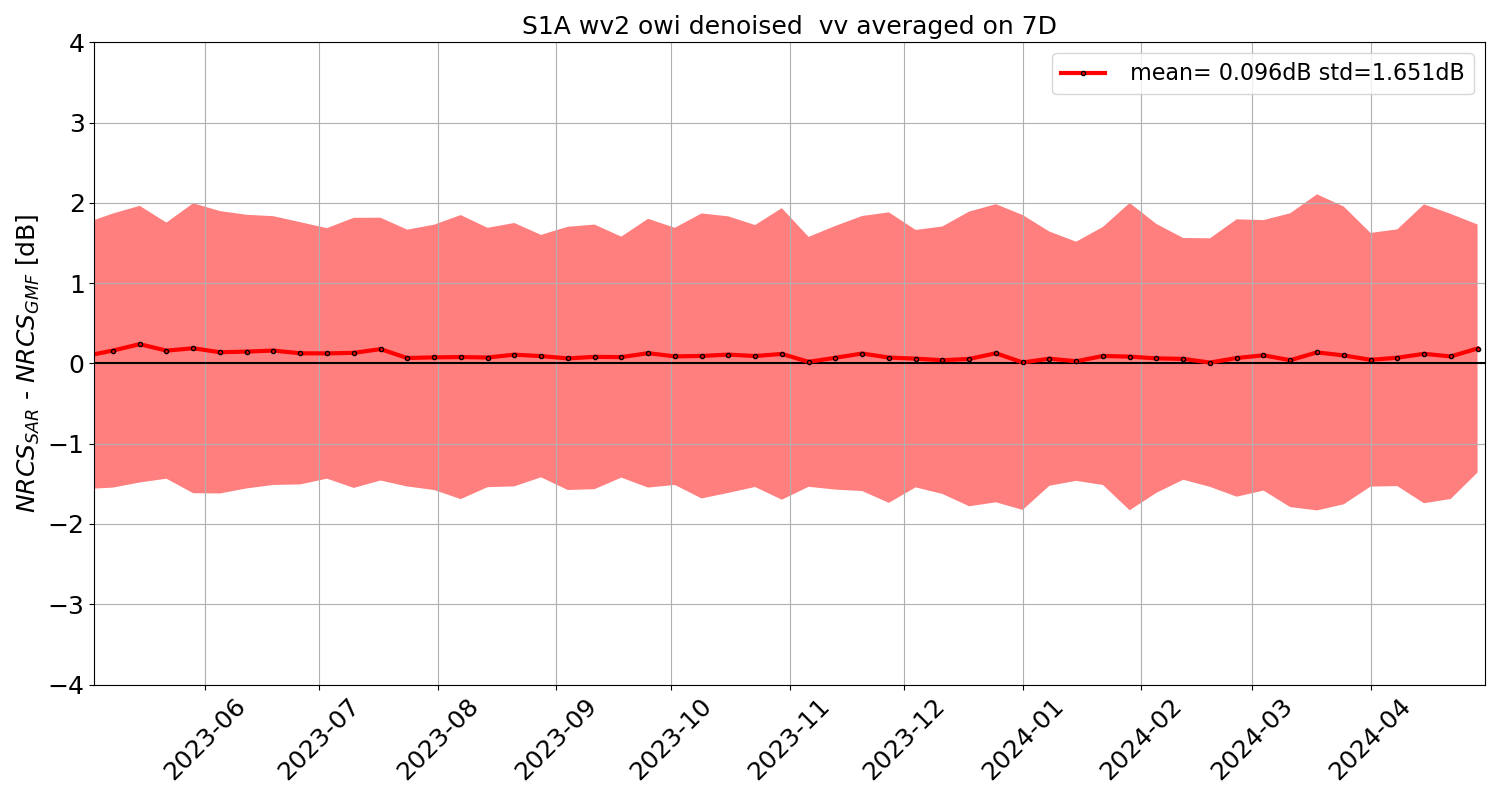
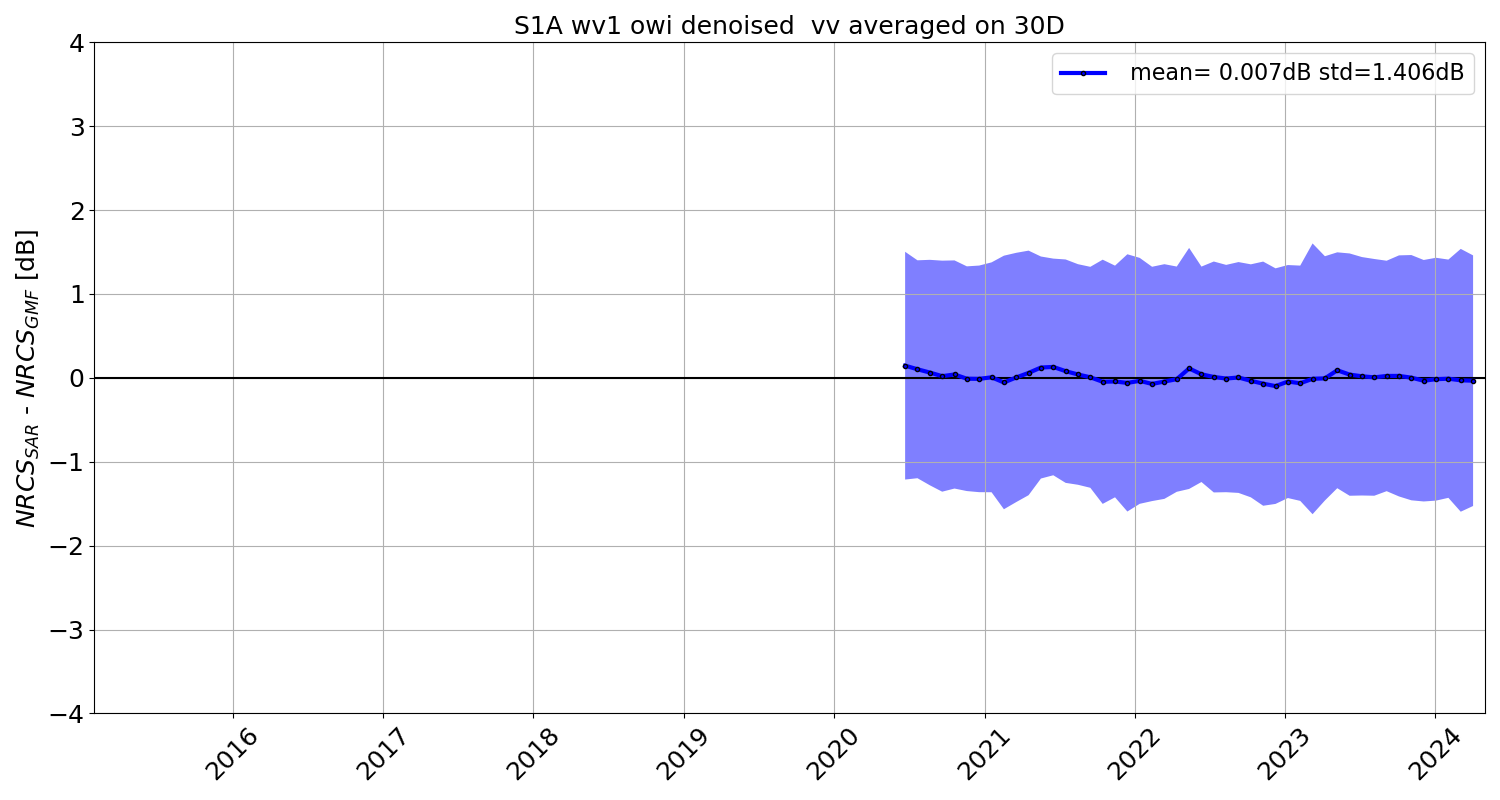
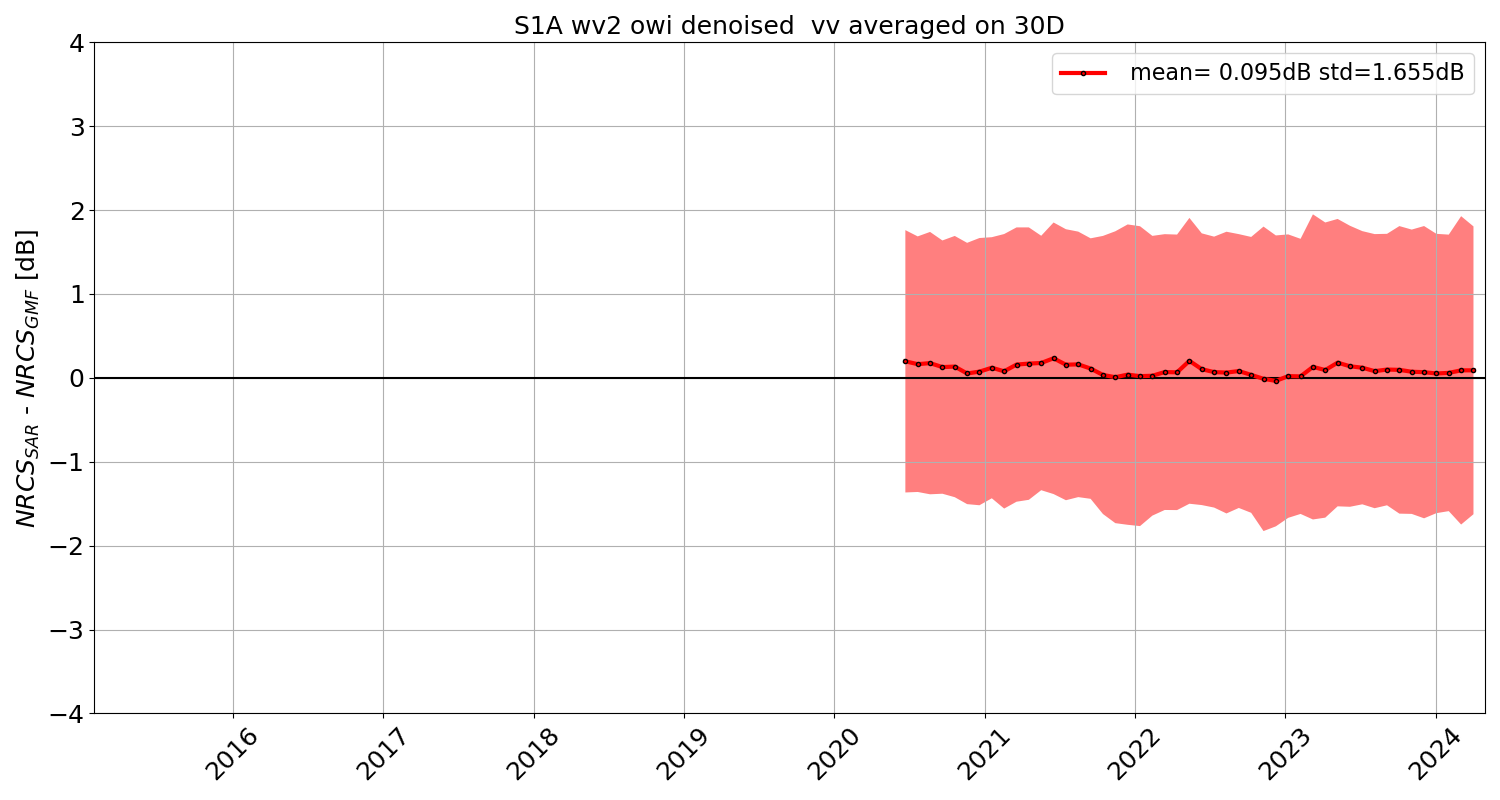
1.2.2 OWI component
Current Year
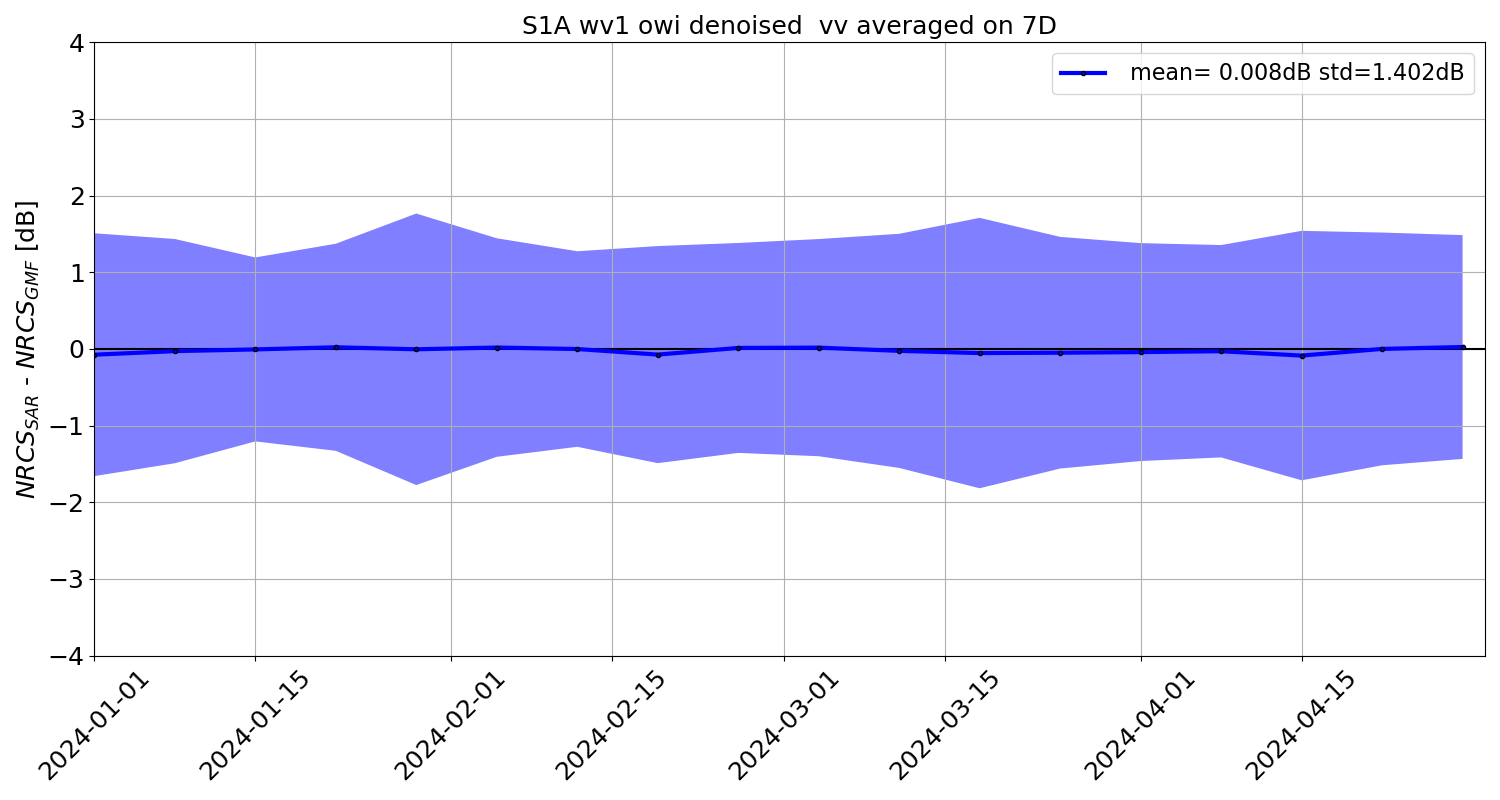

Last 30 days
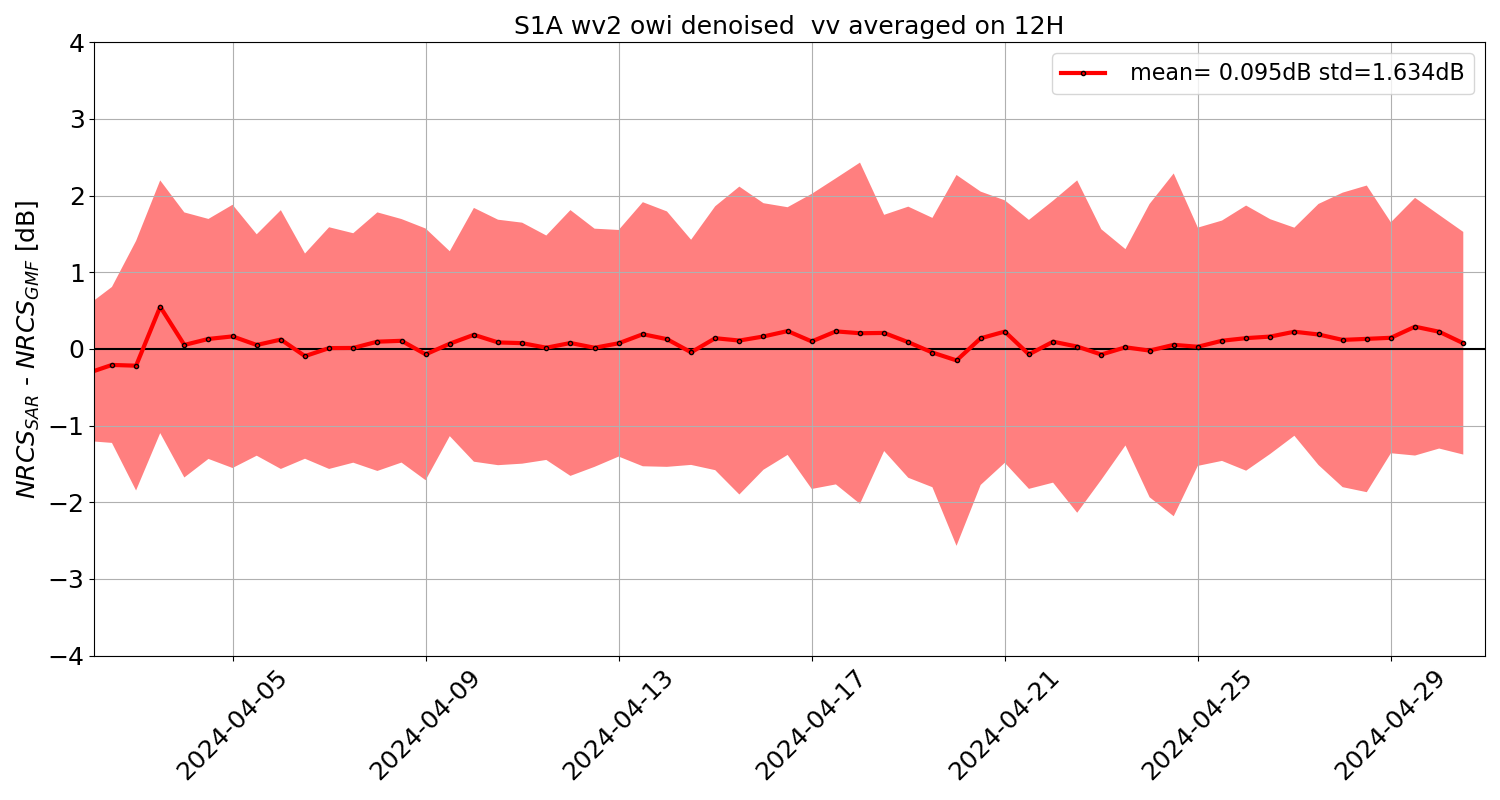
Last 365 days
Full mission
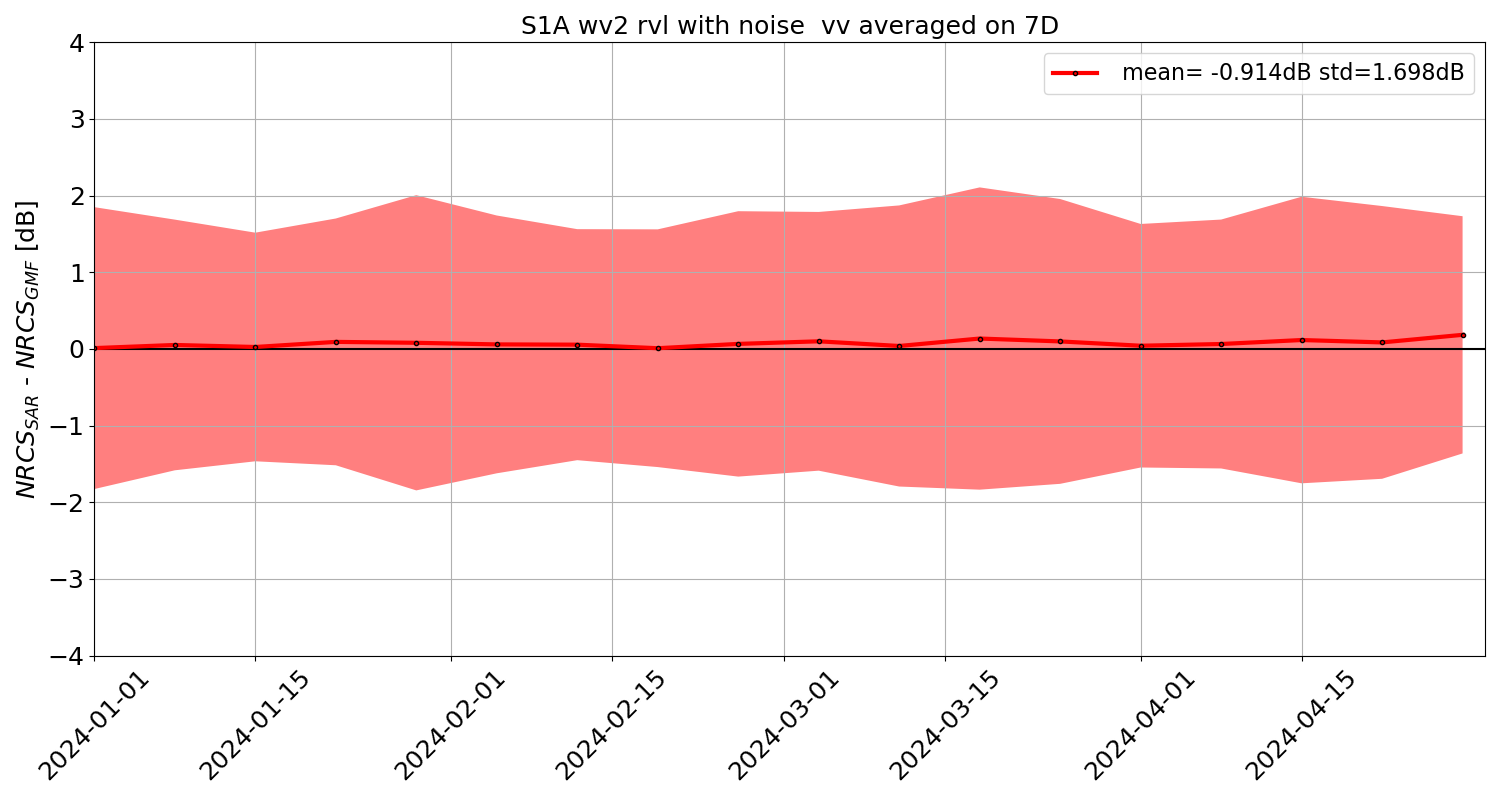
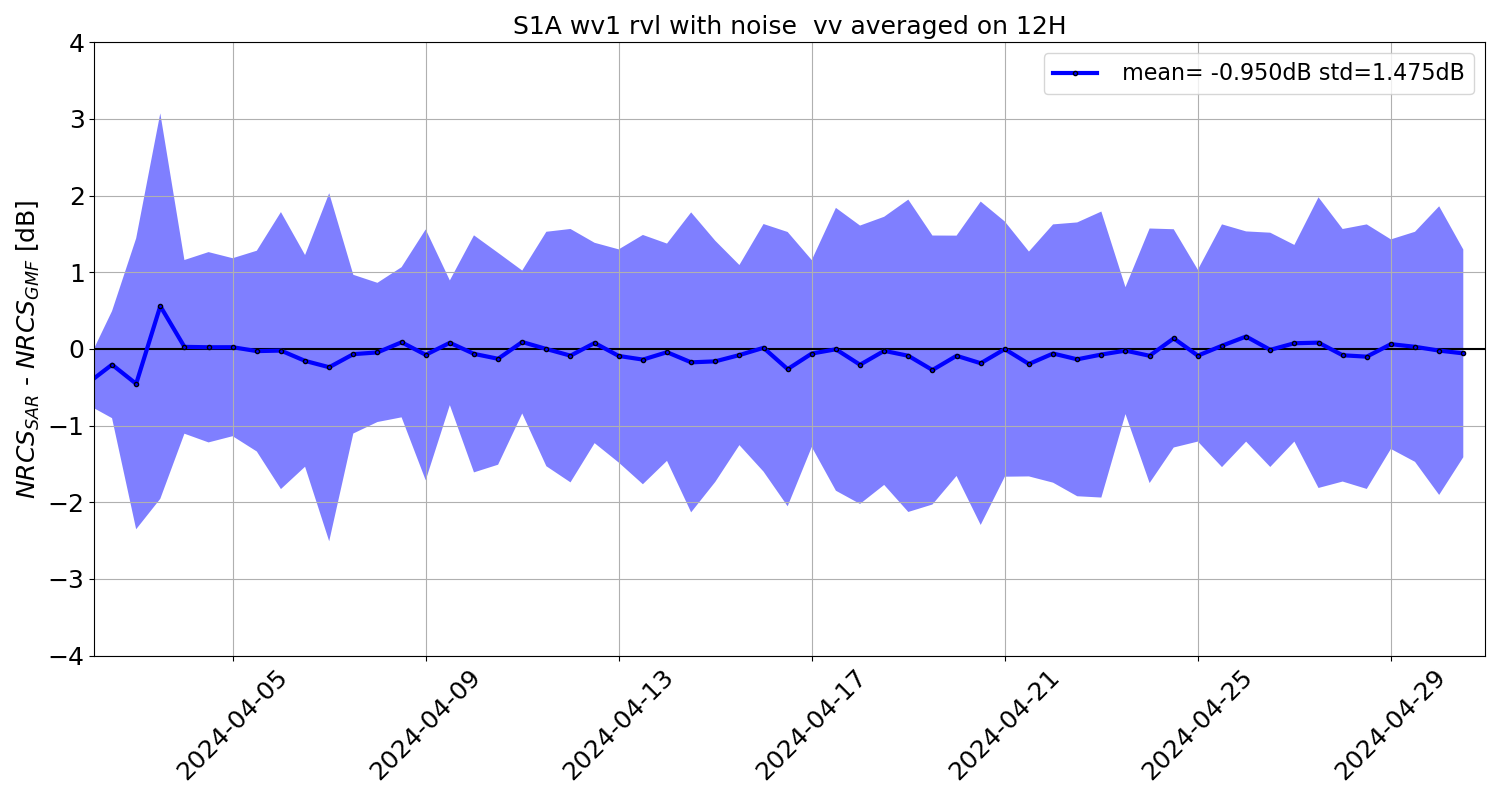
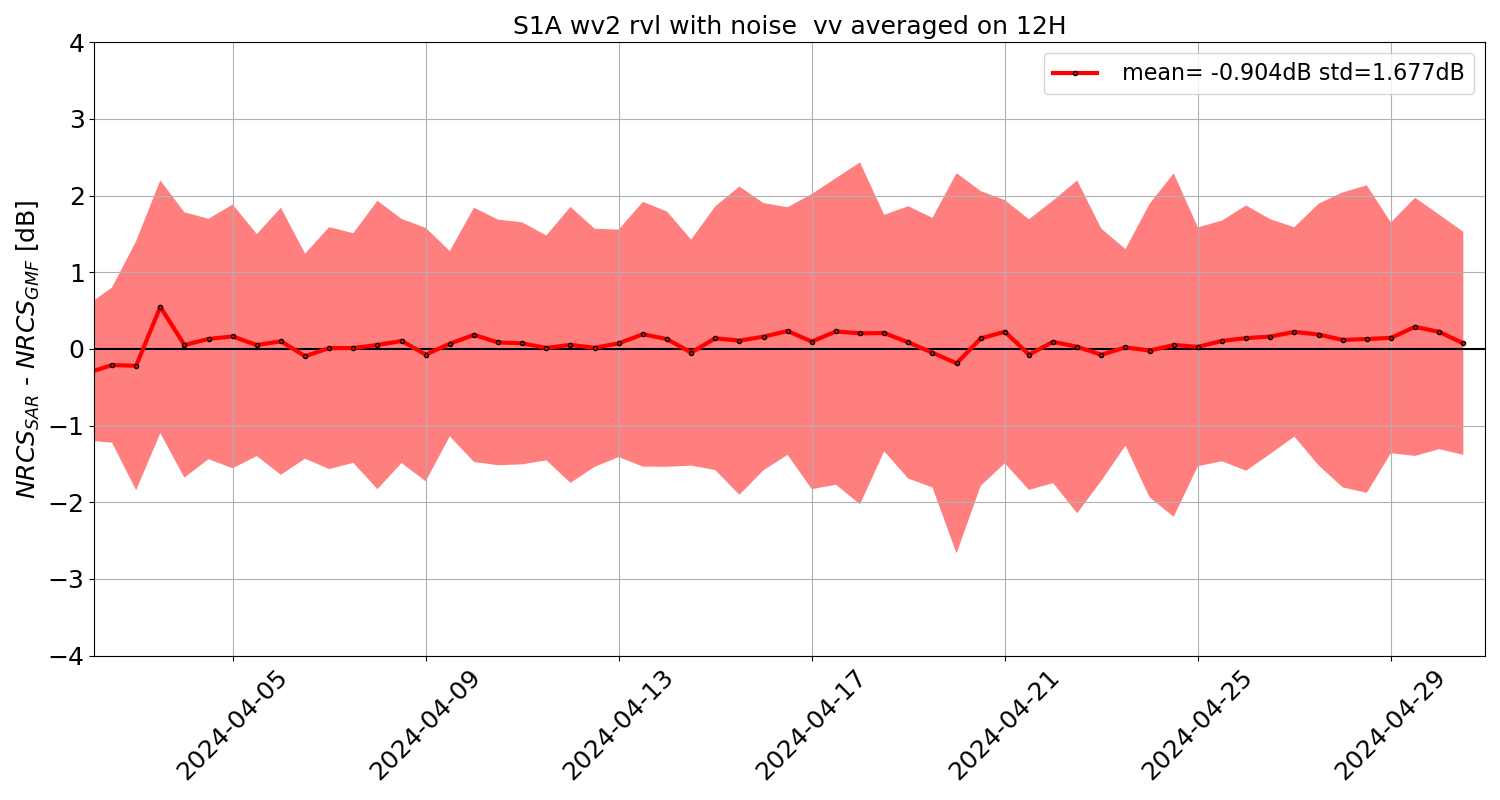
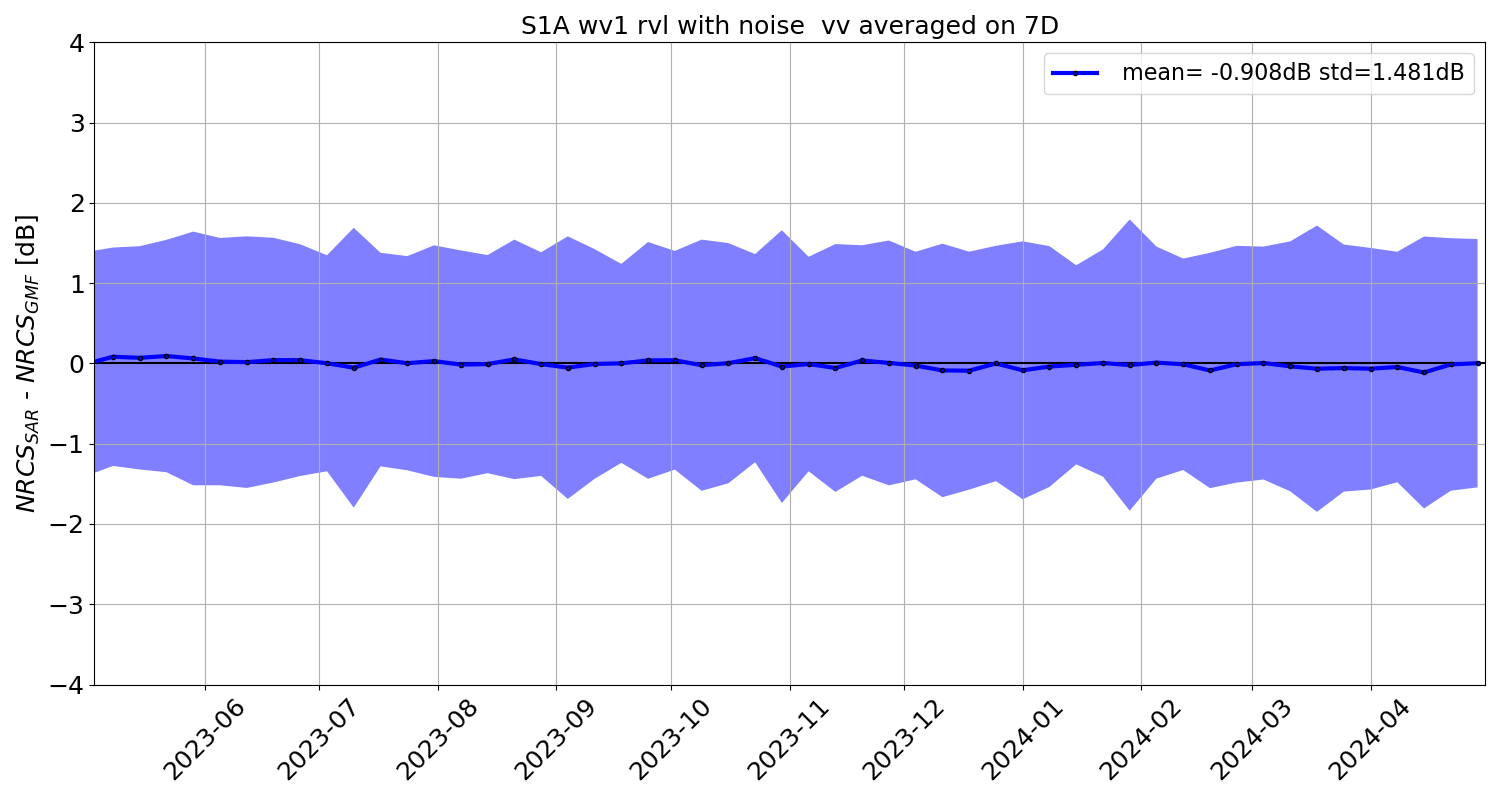
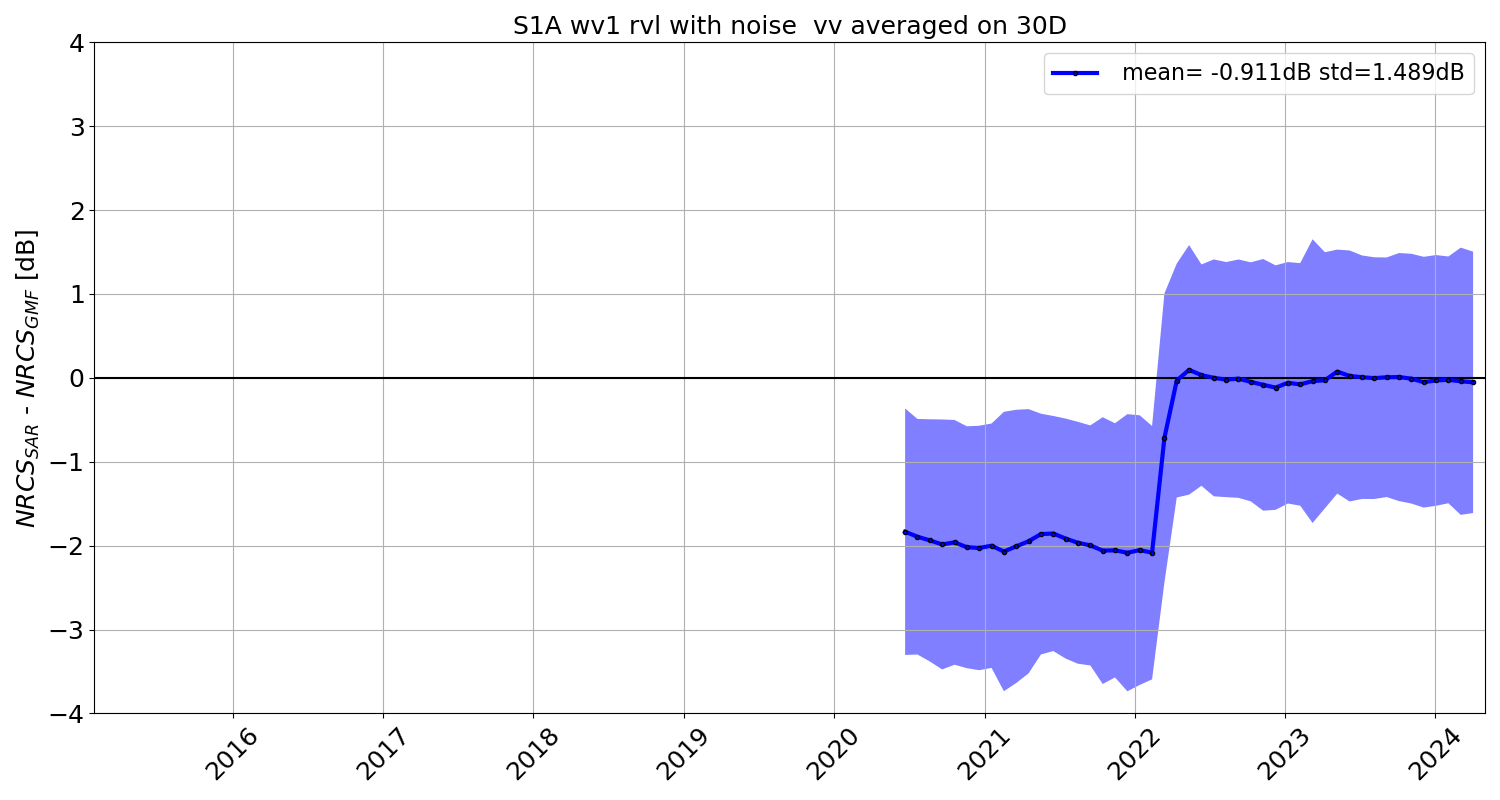
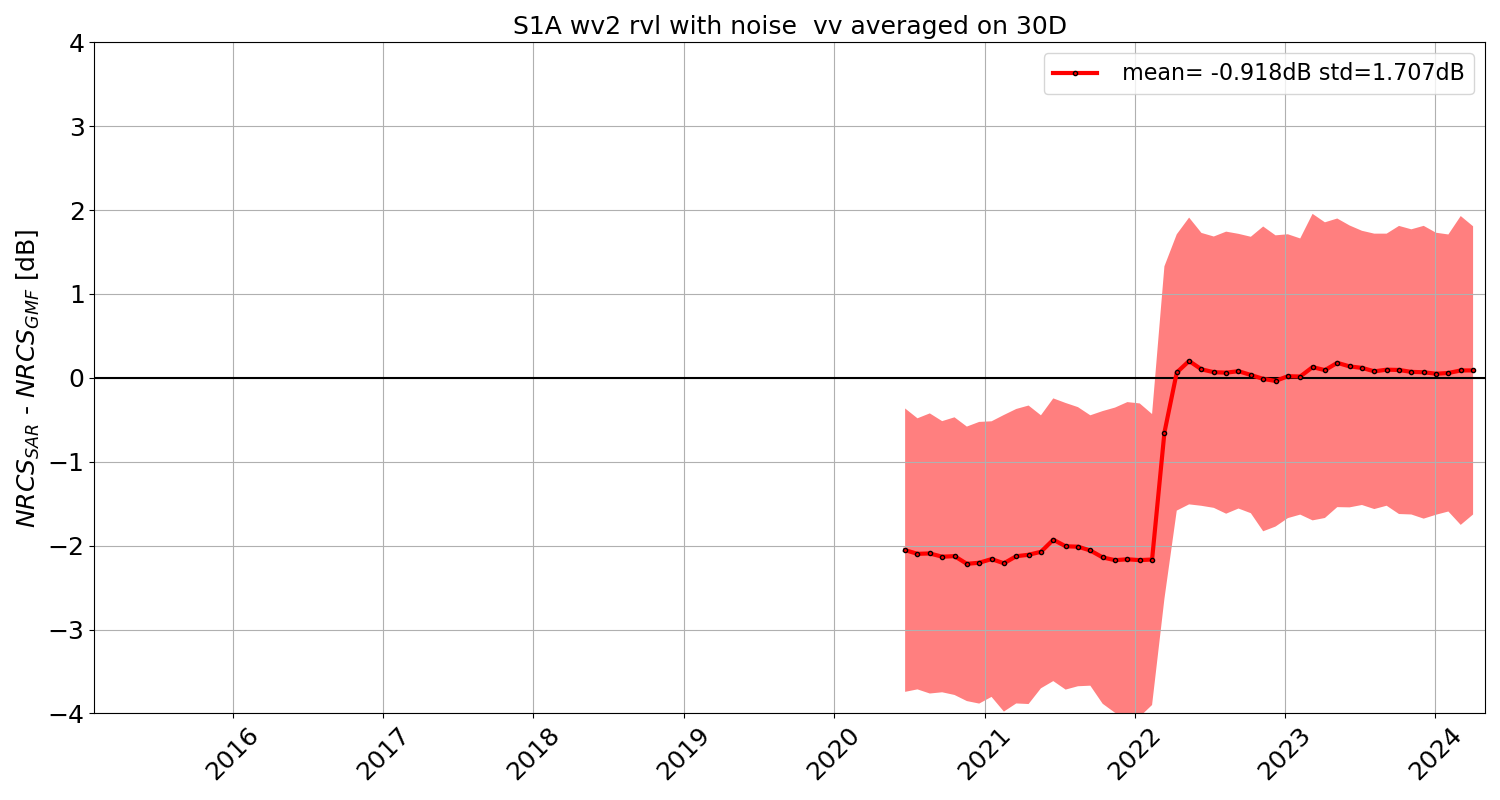
1.2.3 RVL component
Current Year

Last 30 days
Last 365 days

Full mission
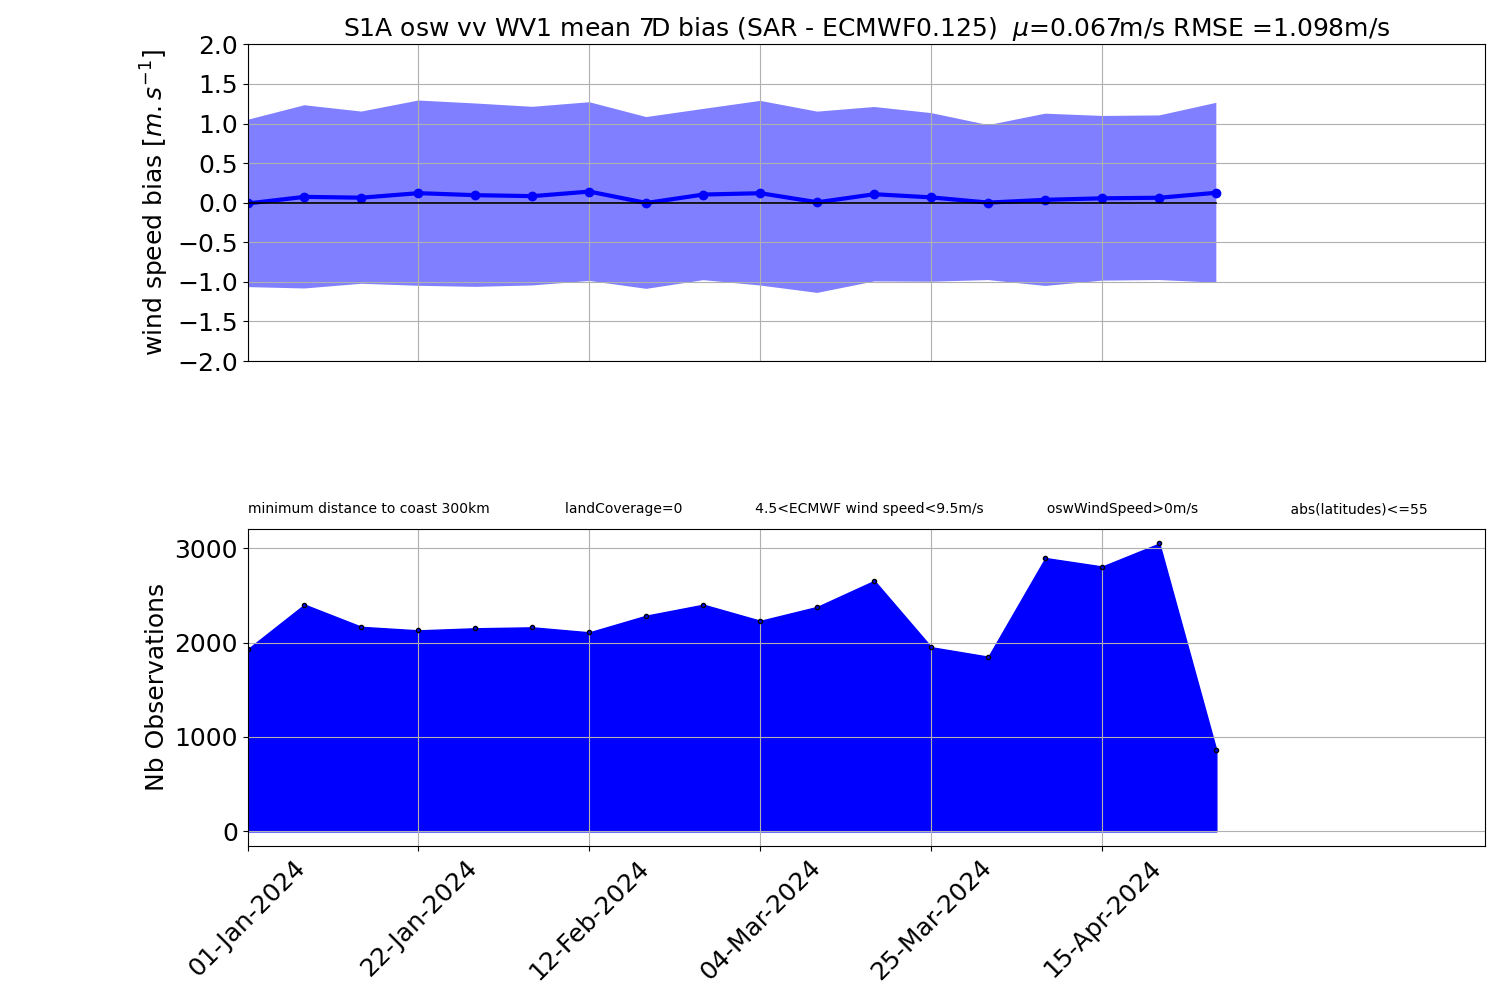
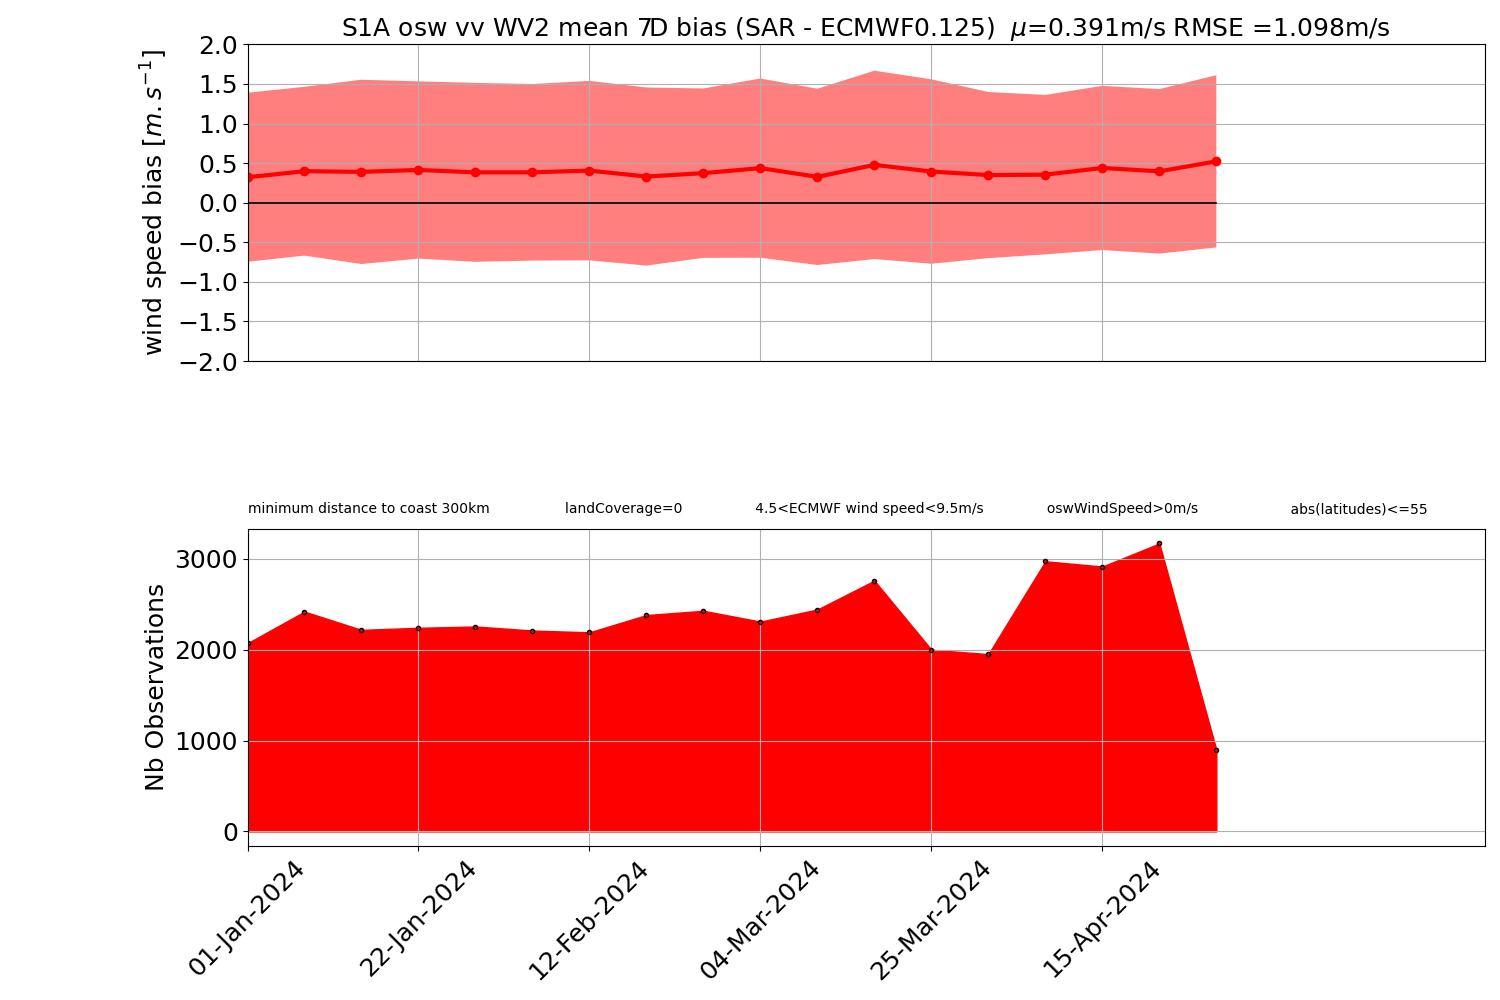
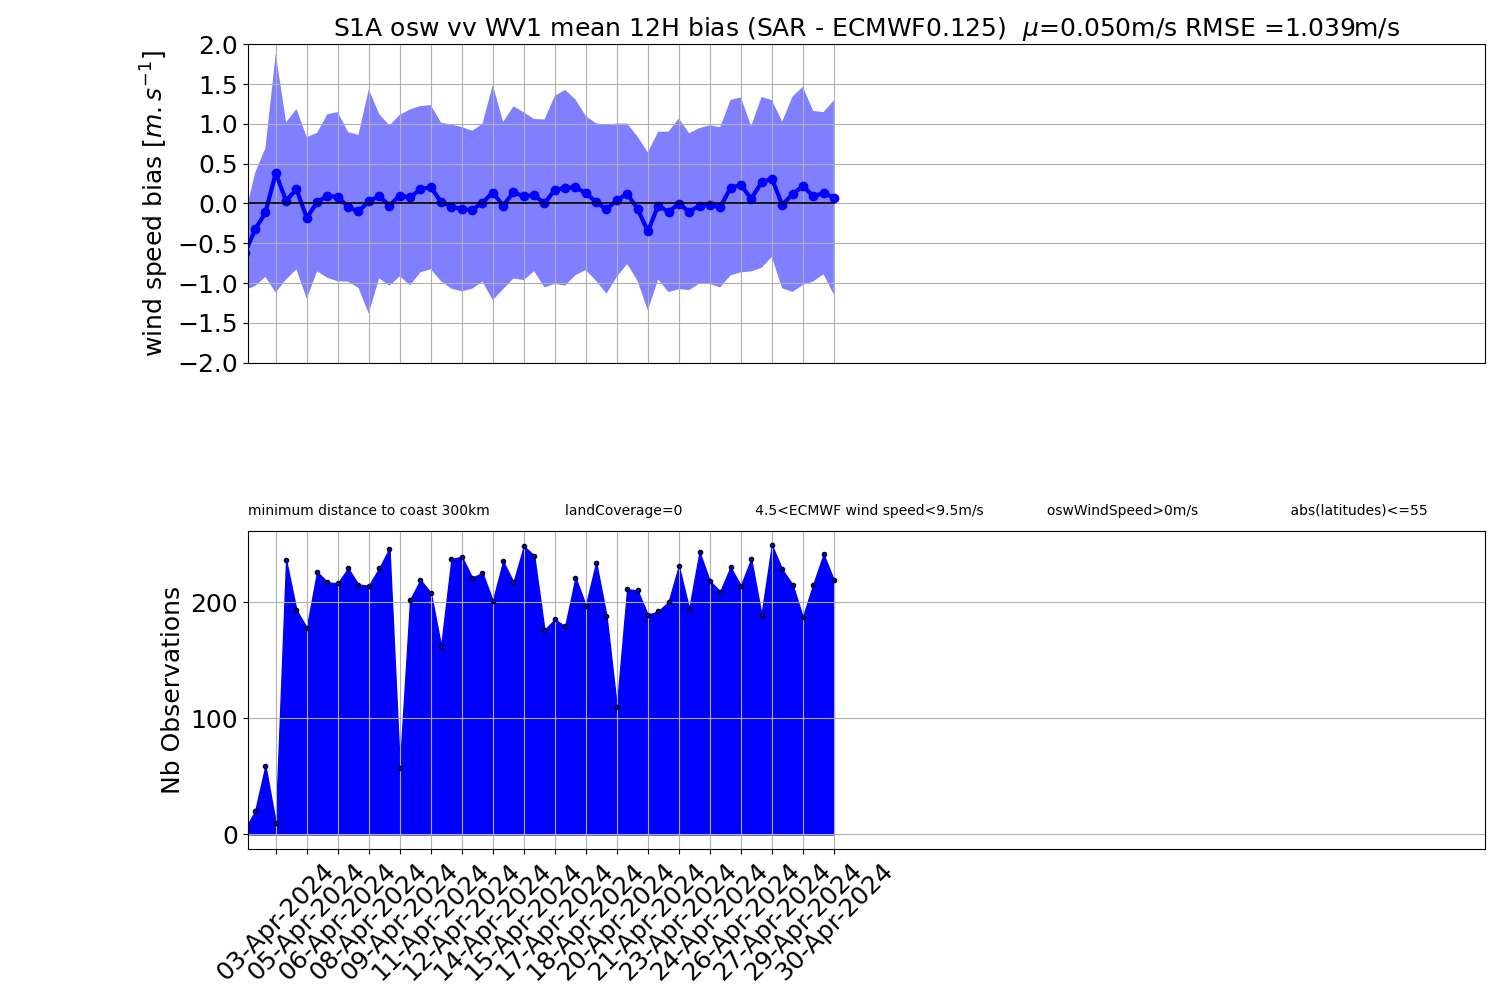
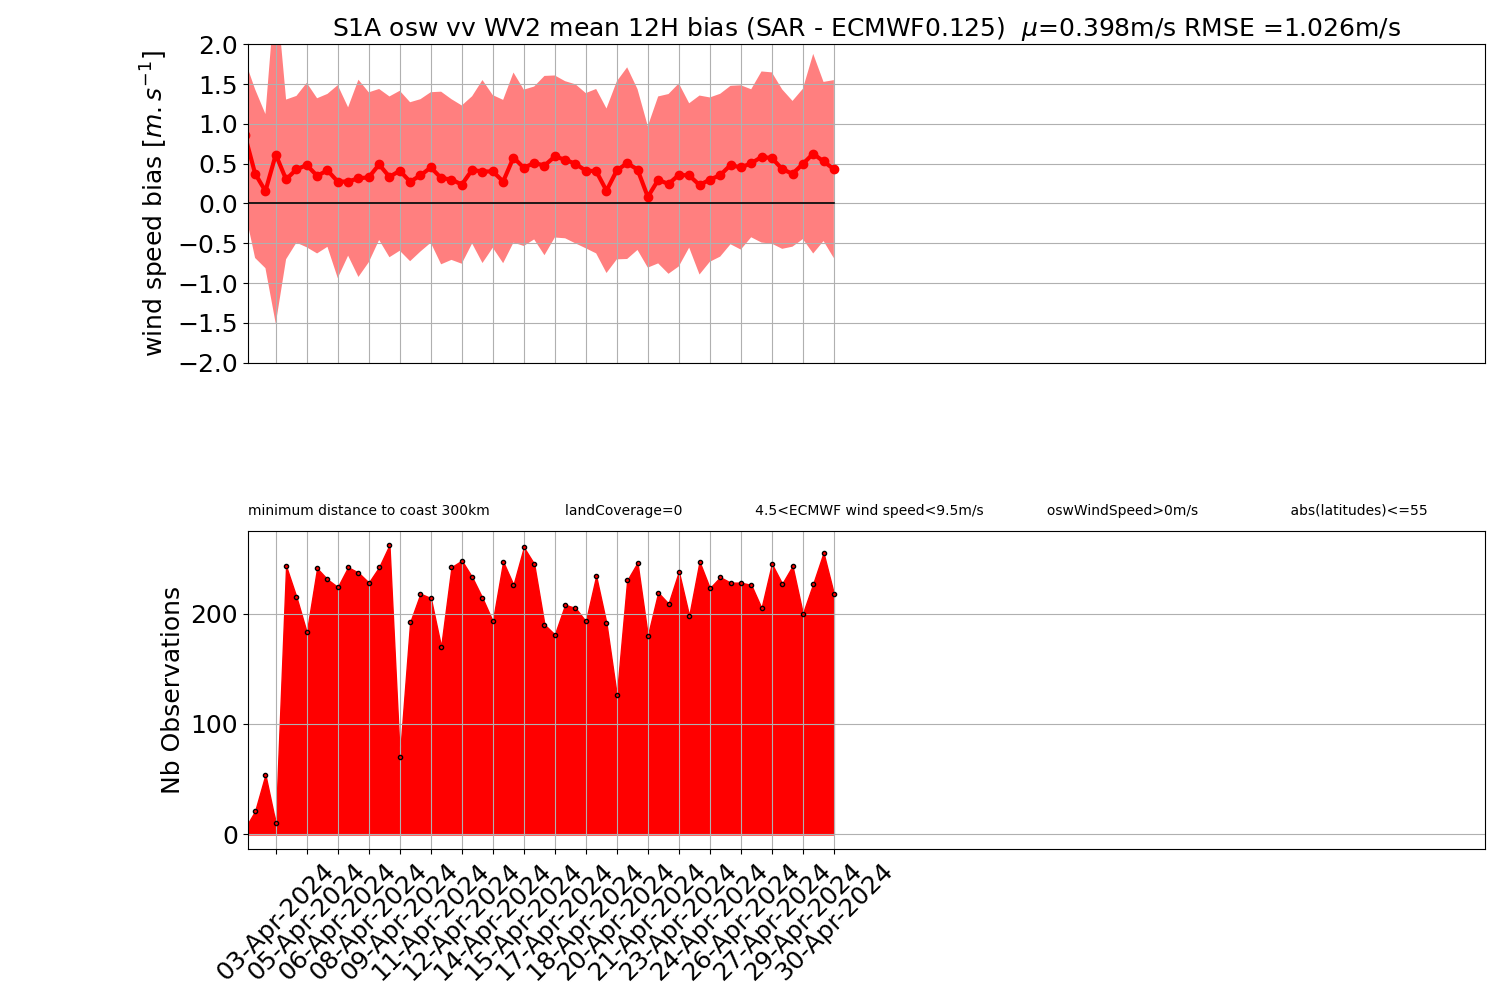
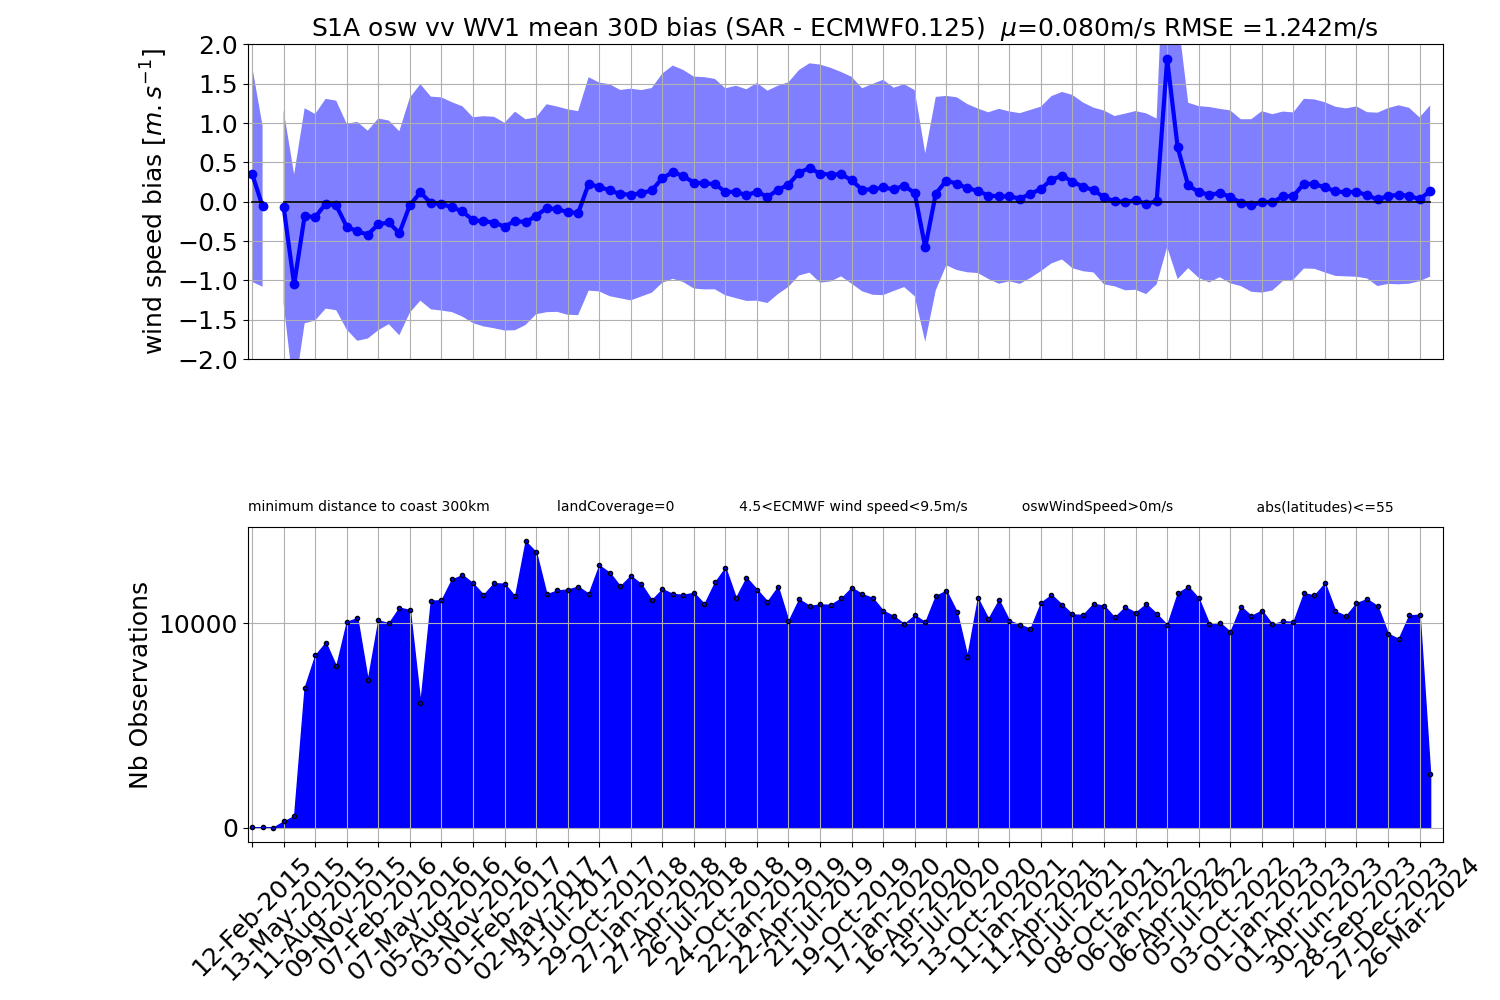
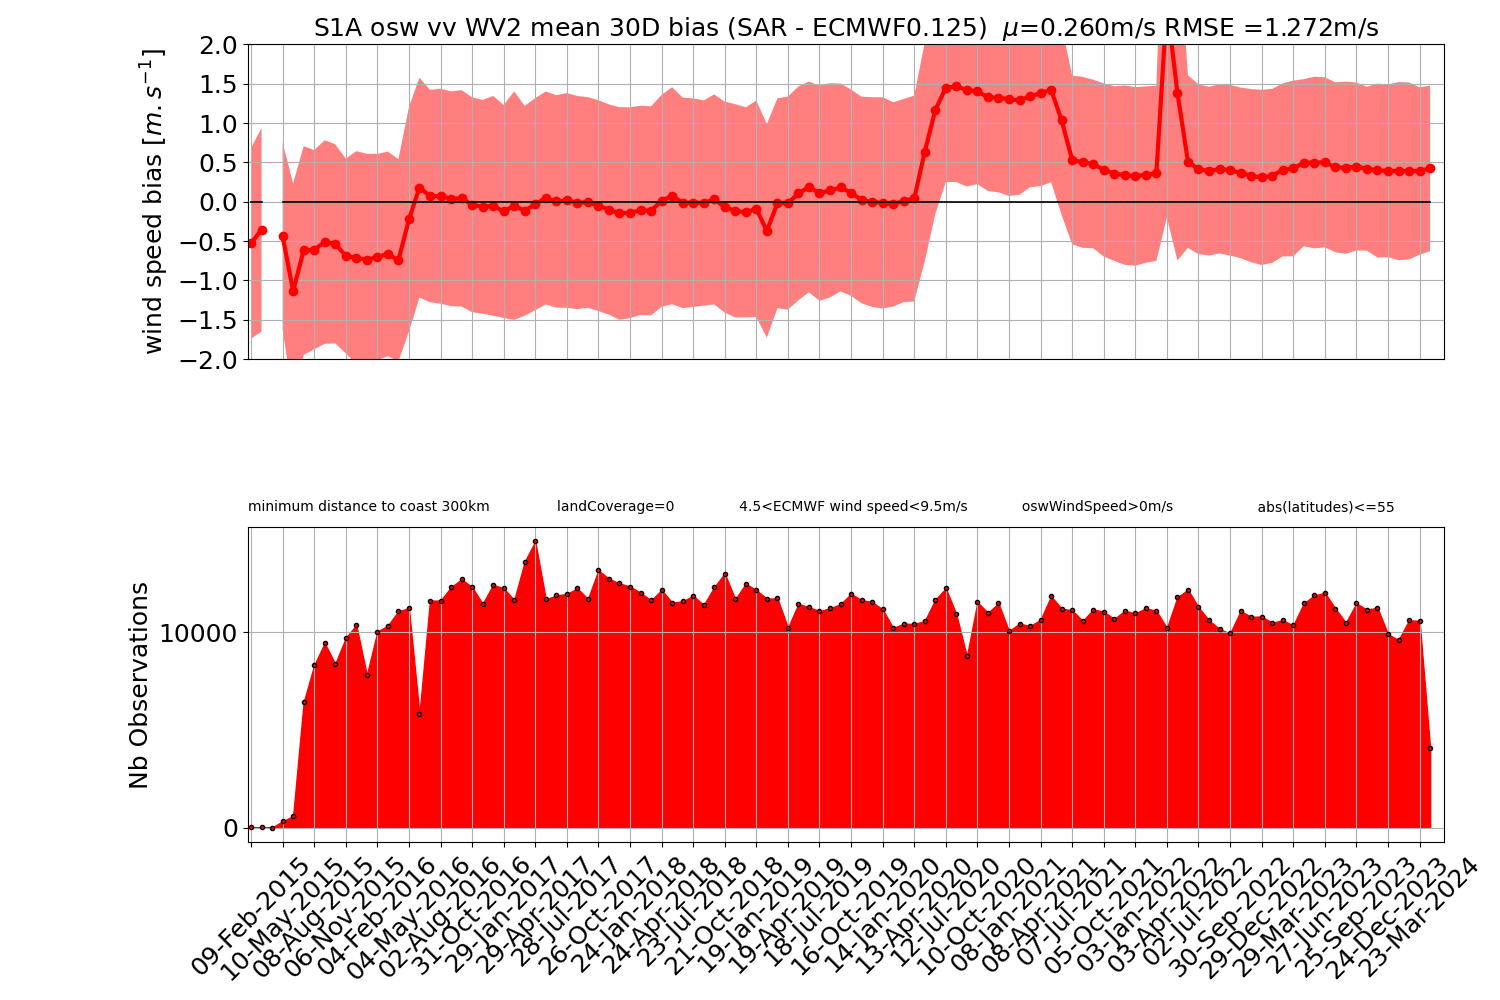
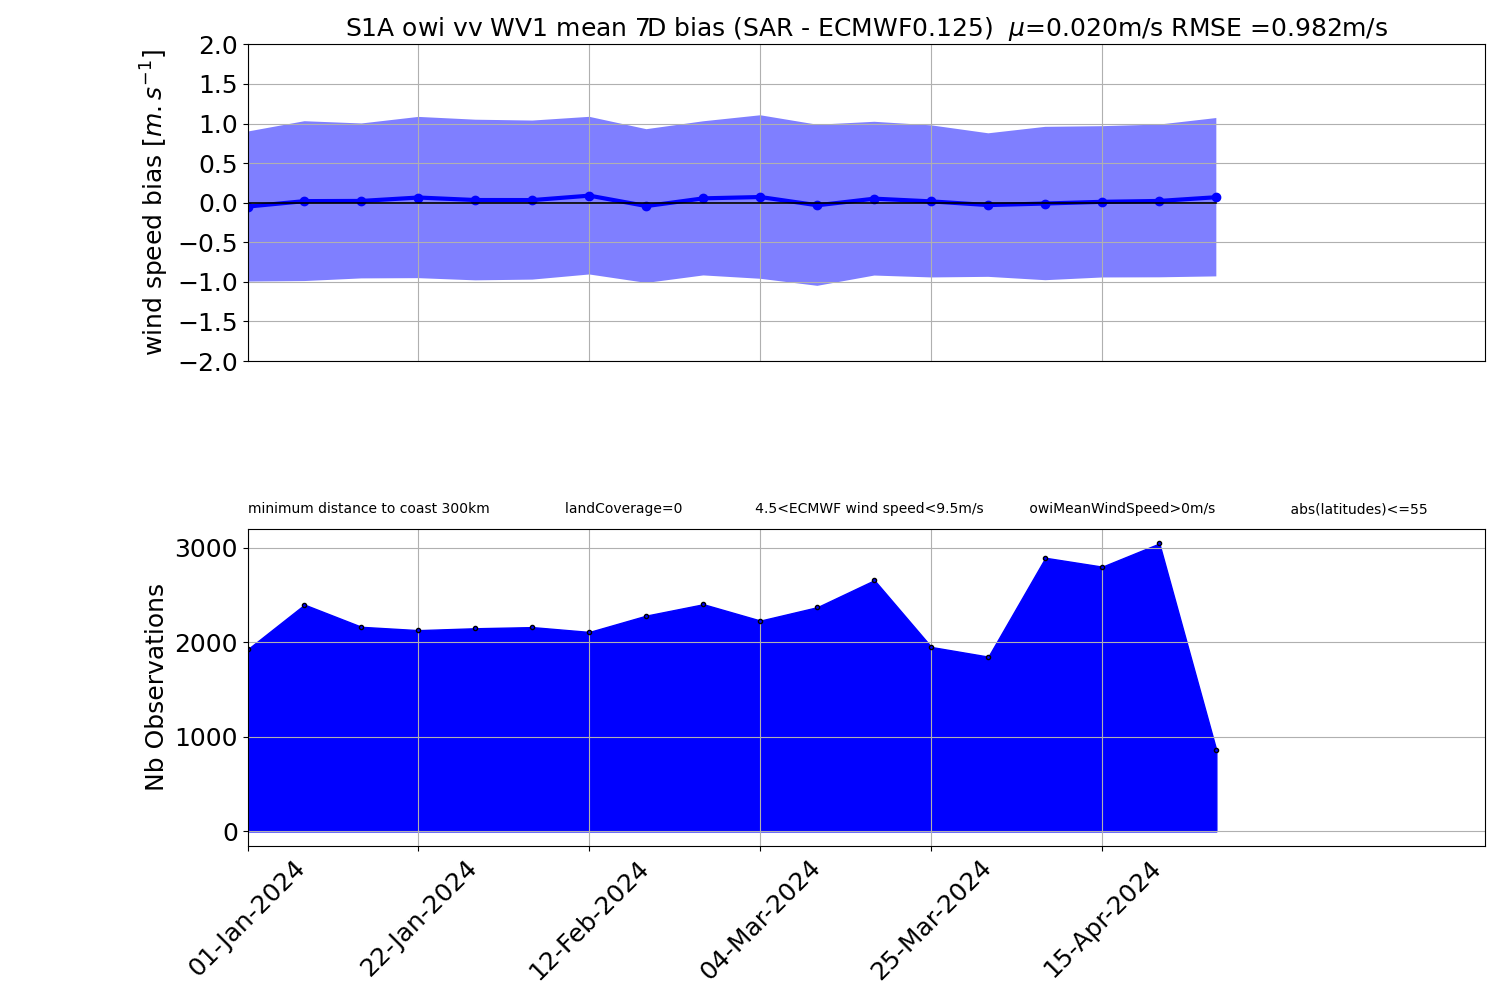
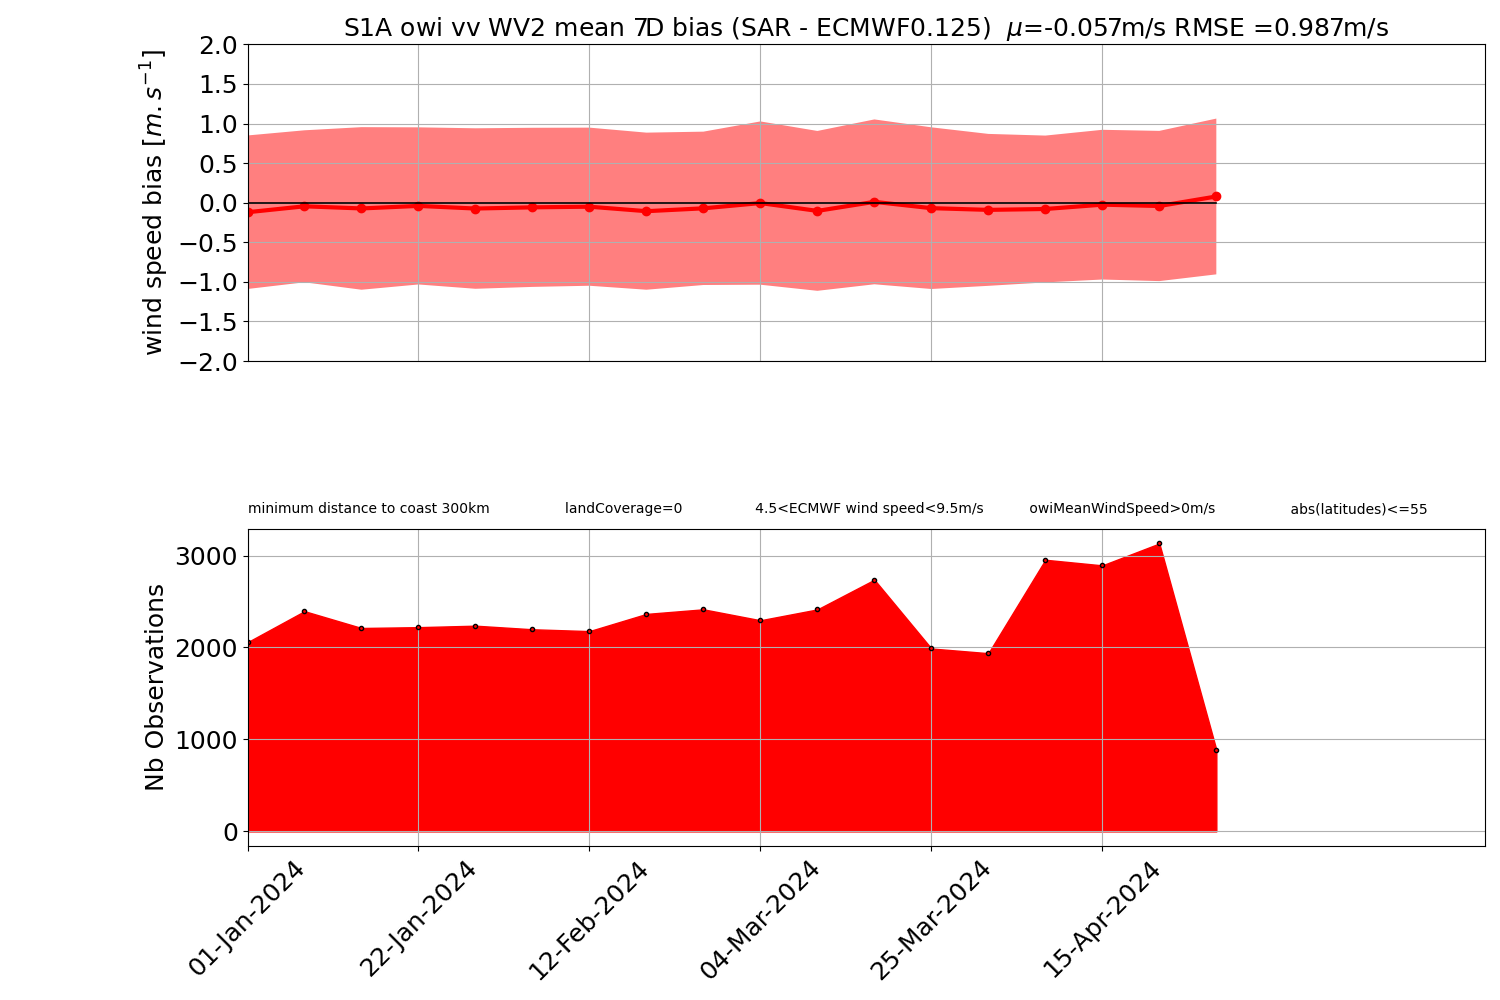
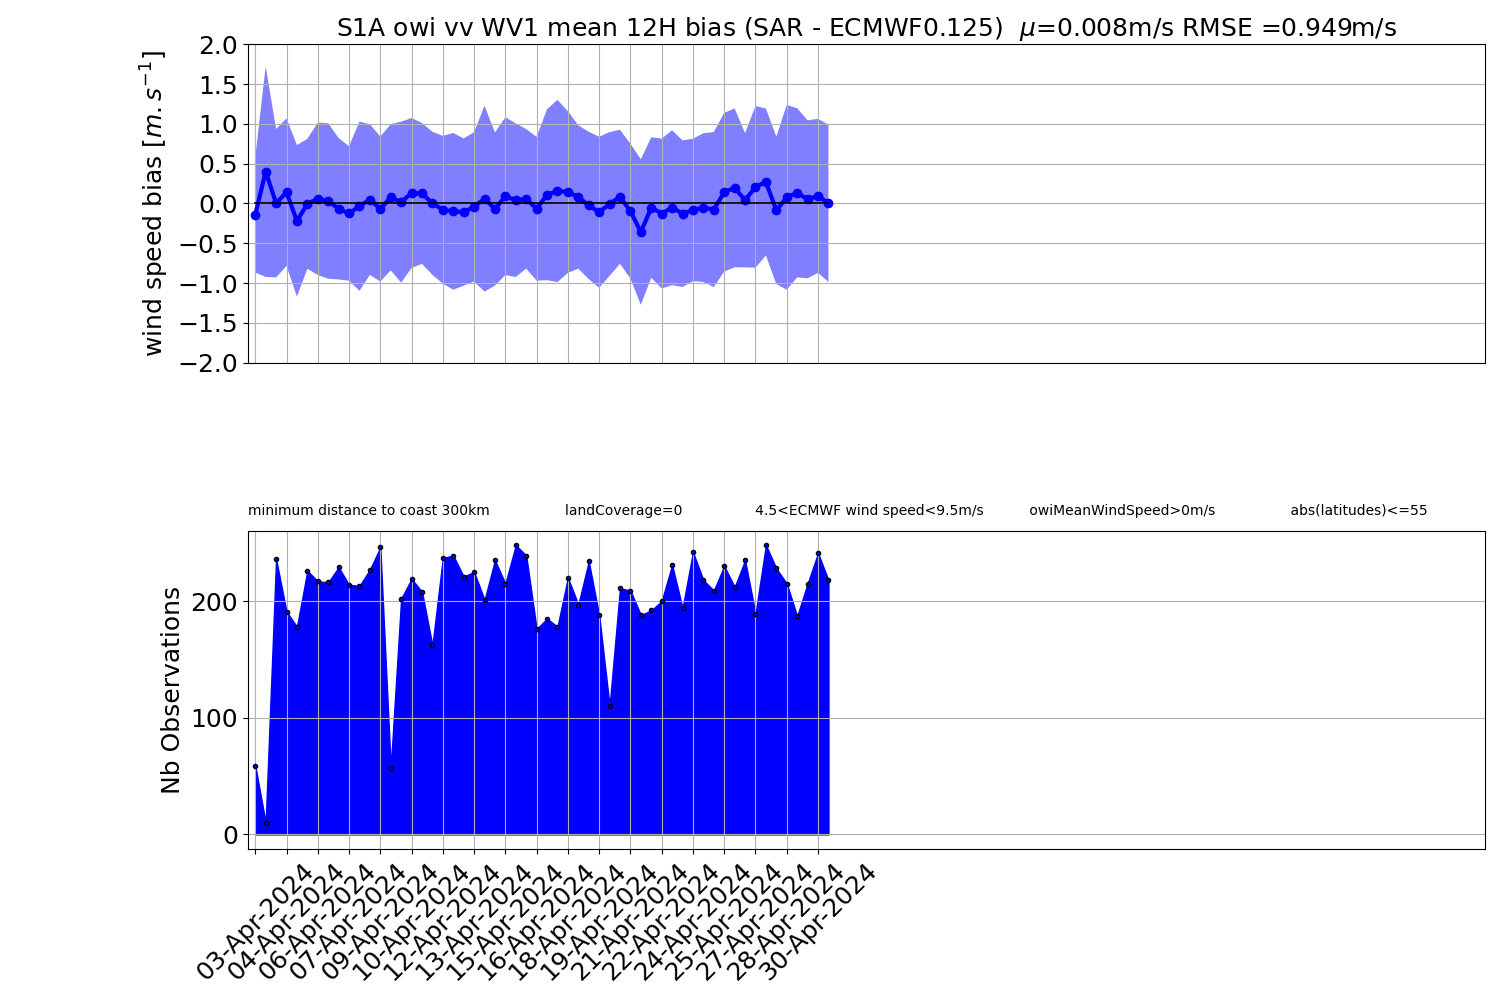
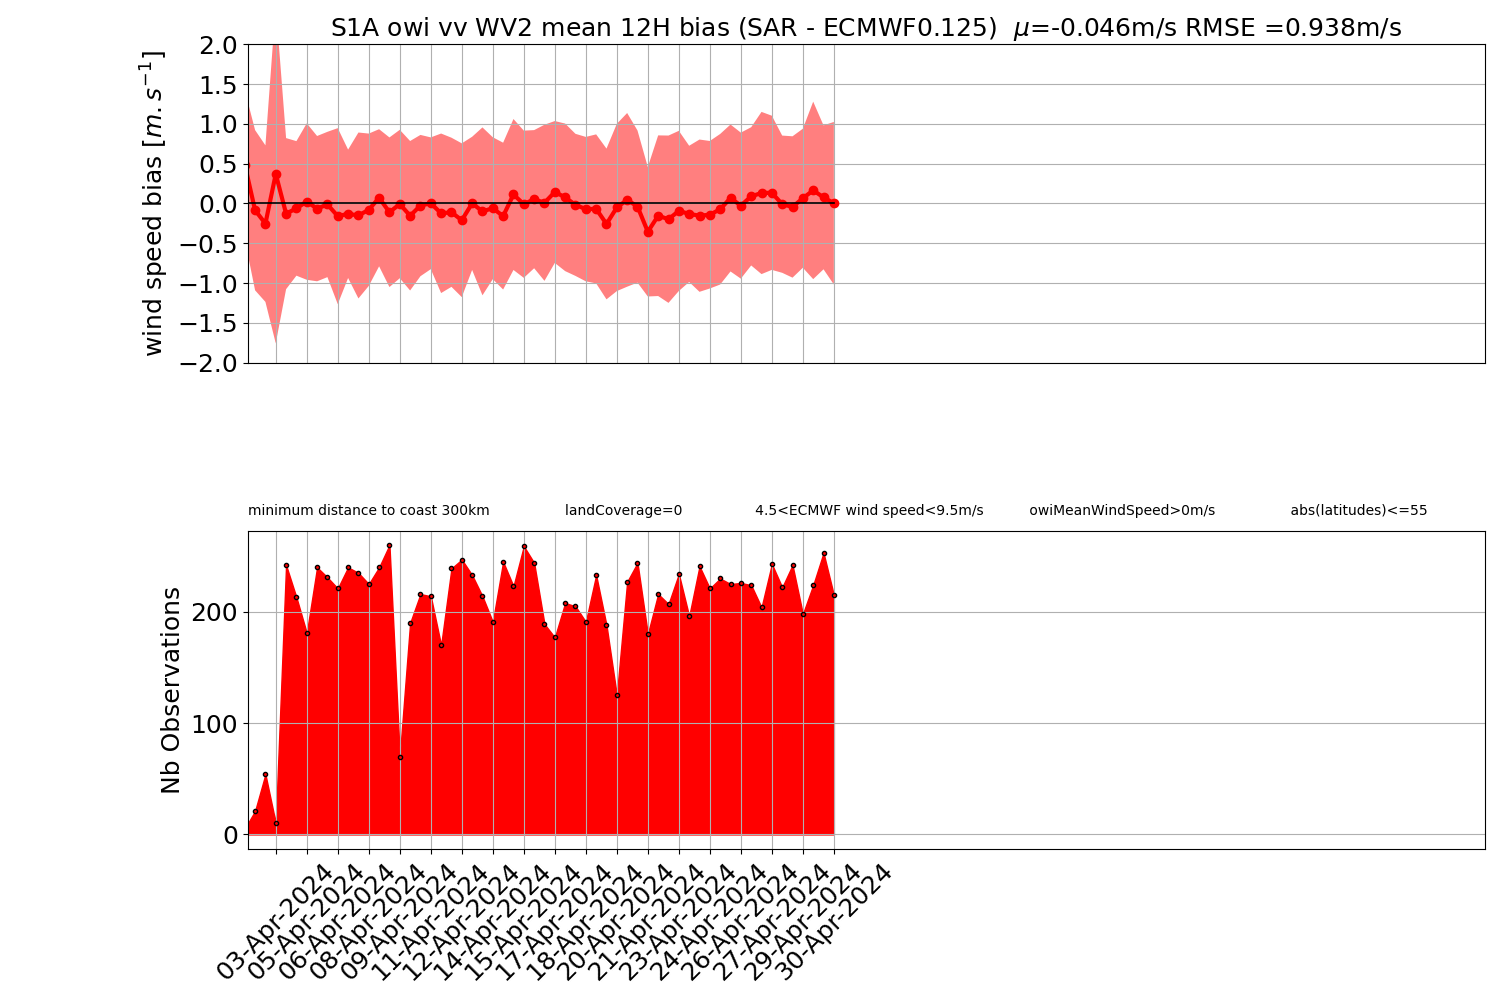
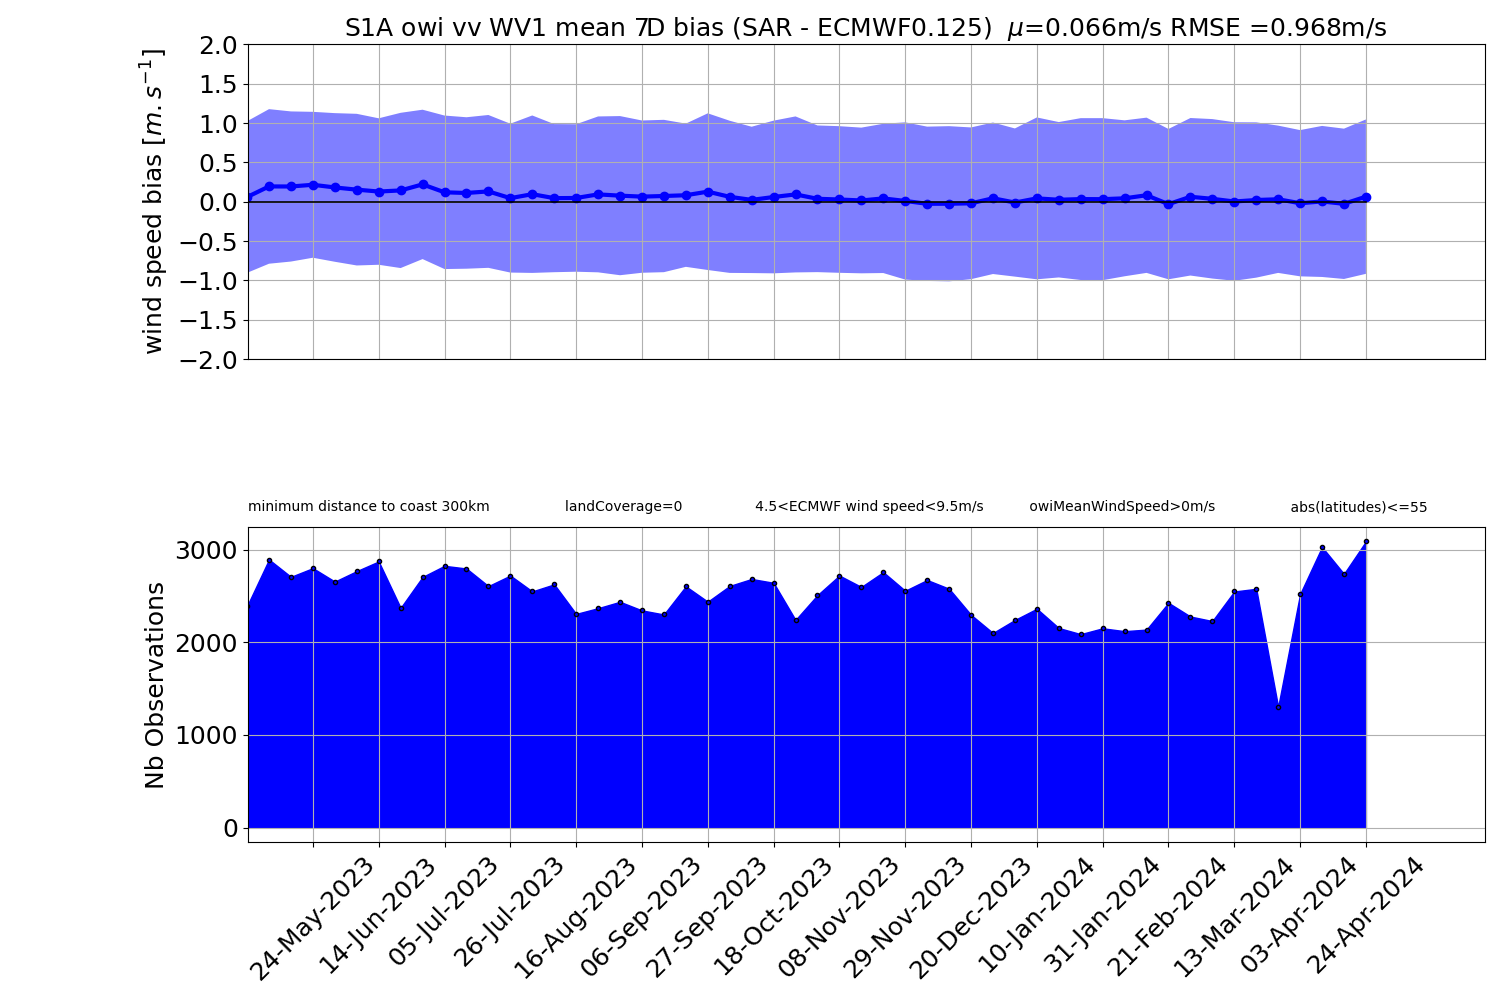
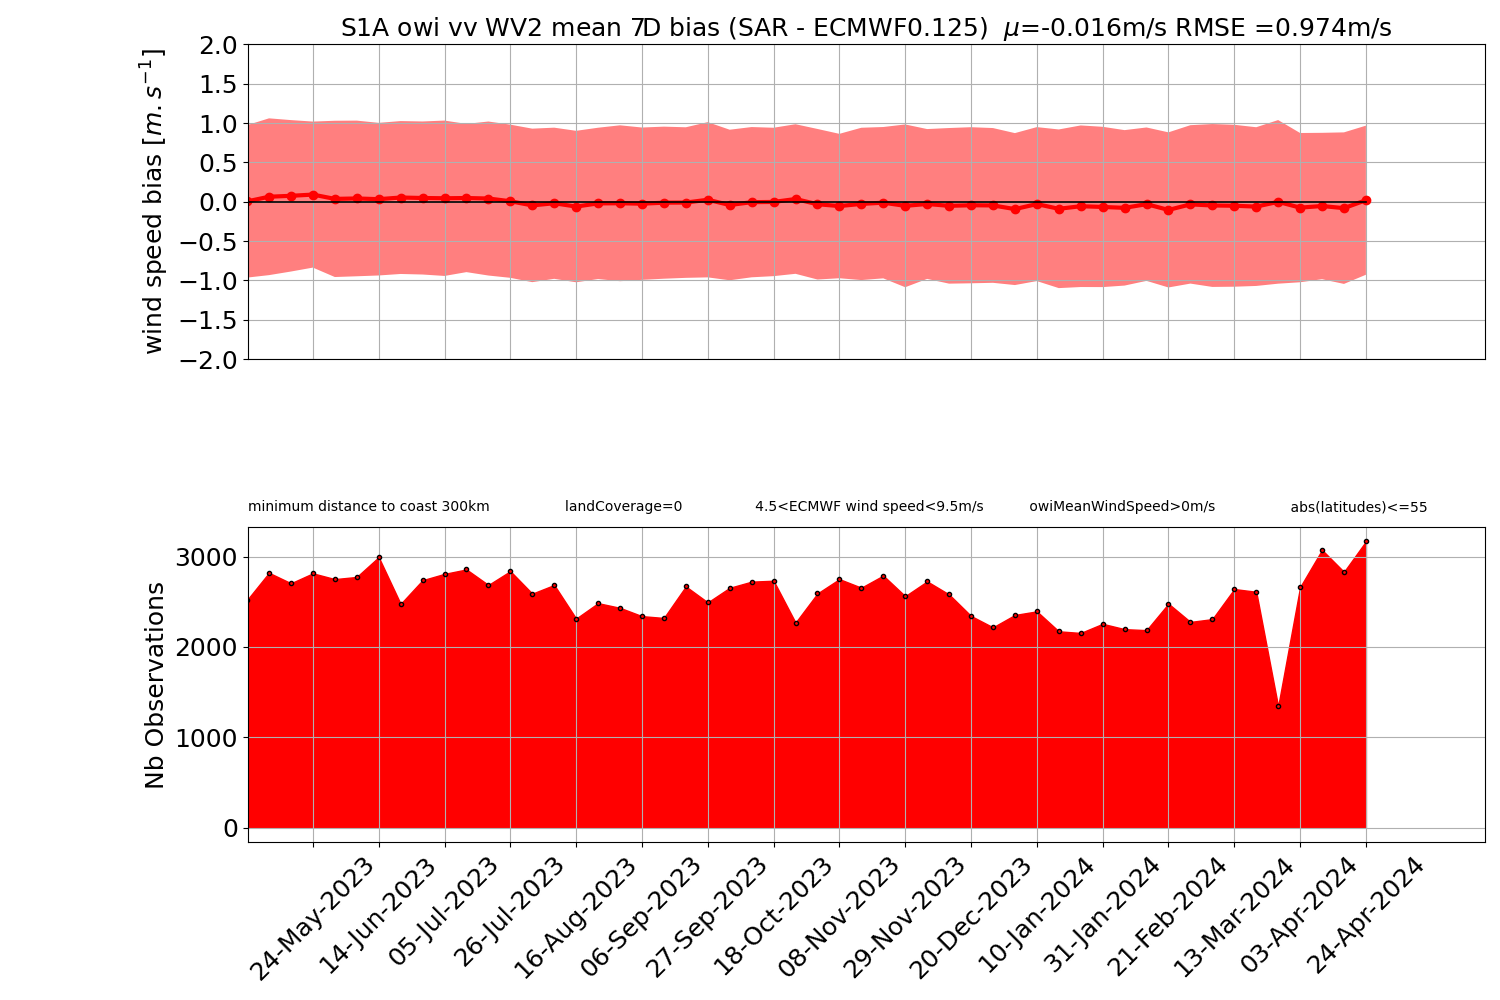
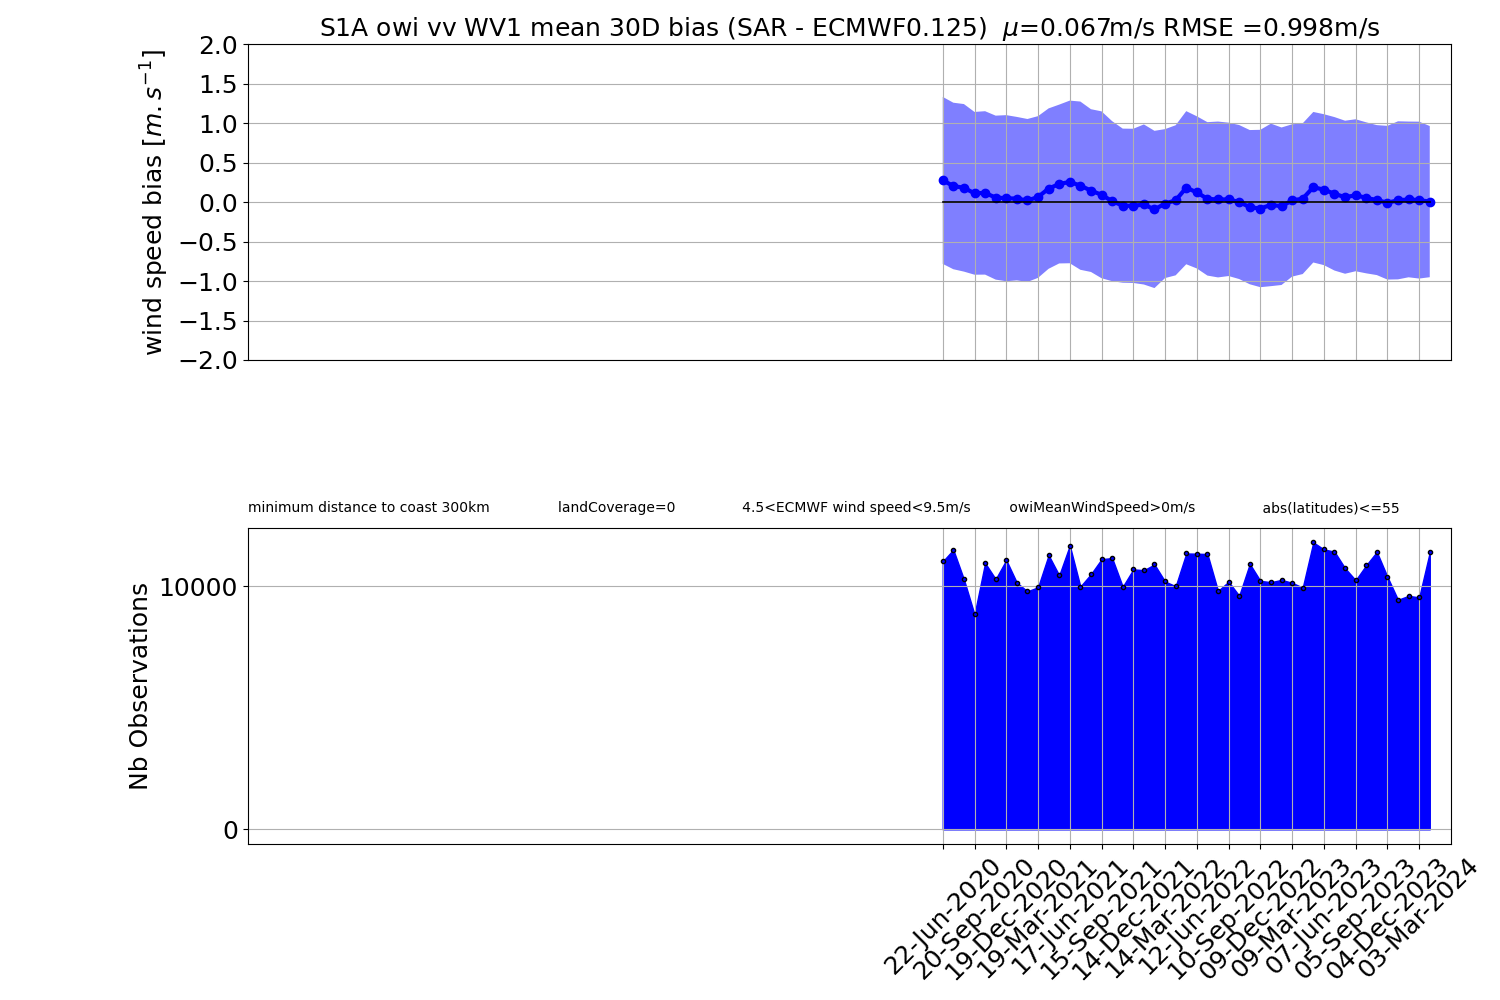
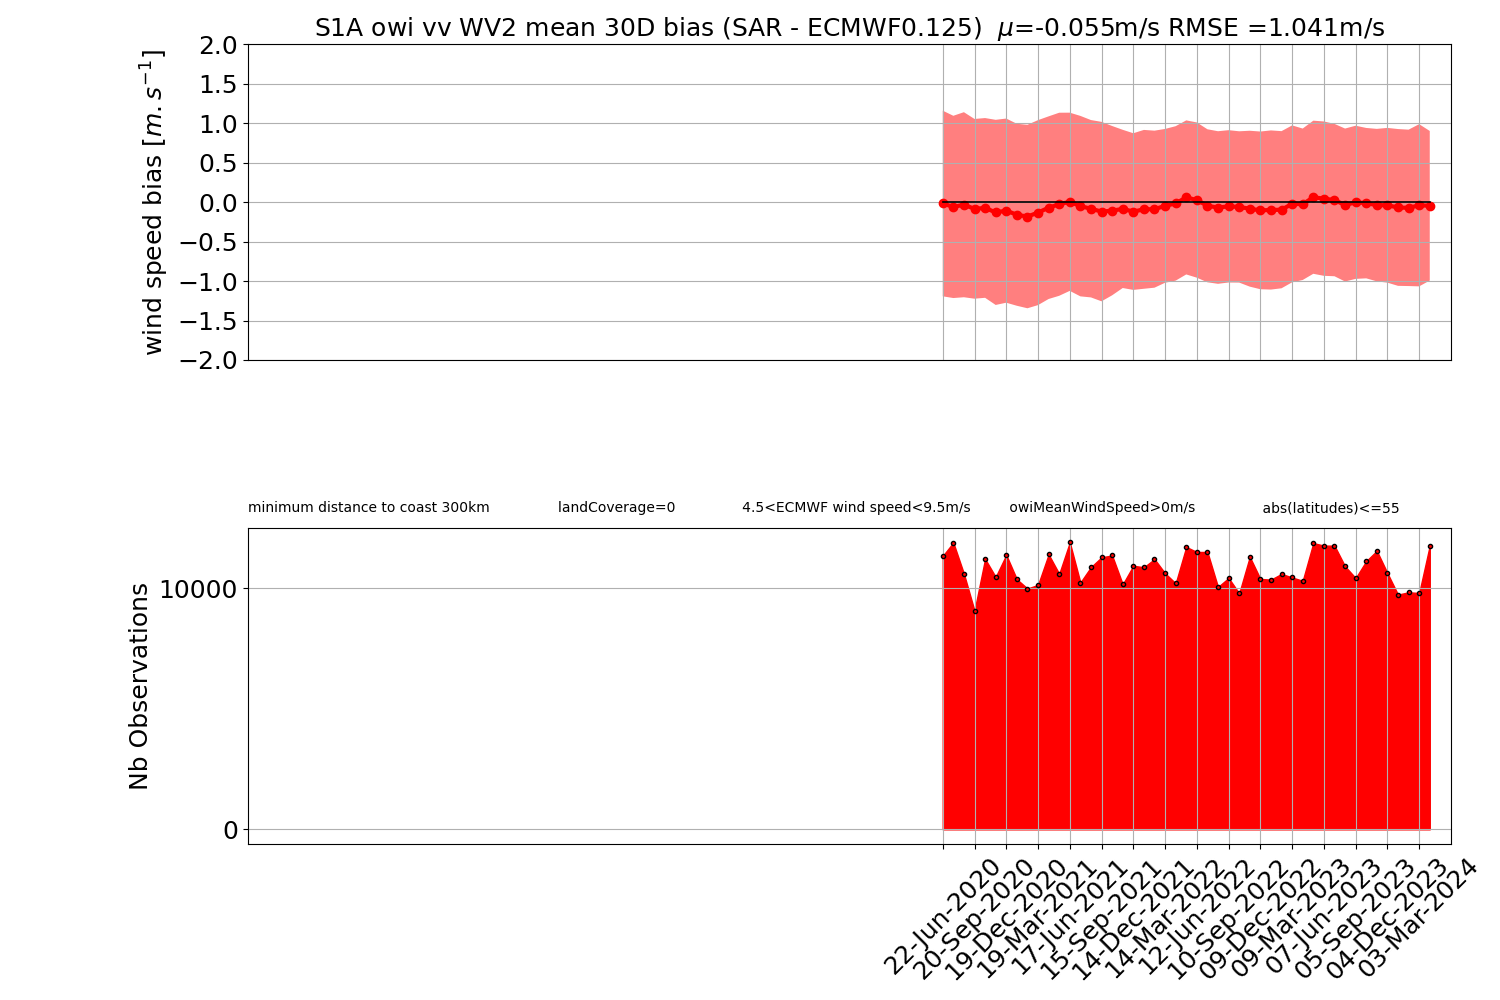
1.3 WV wind speed bias from OCN Level-2 products with respect to ECMWF NRT products
1.3.1 OSW component
Current Year
Last 30 days
Last 365 days

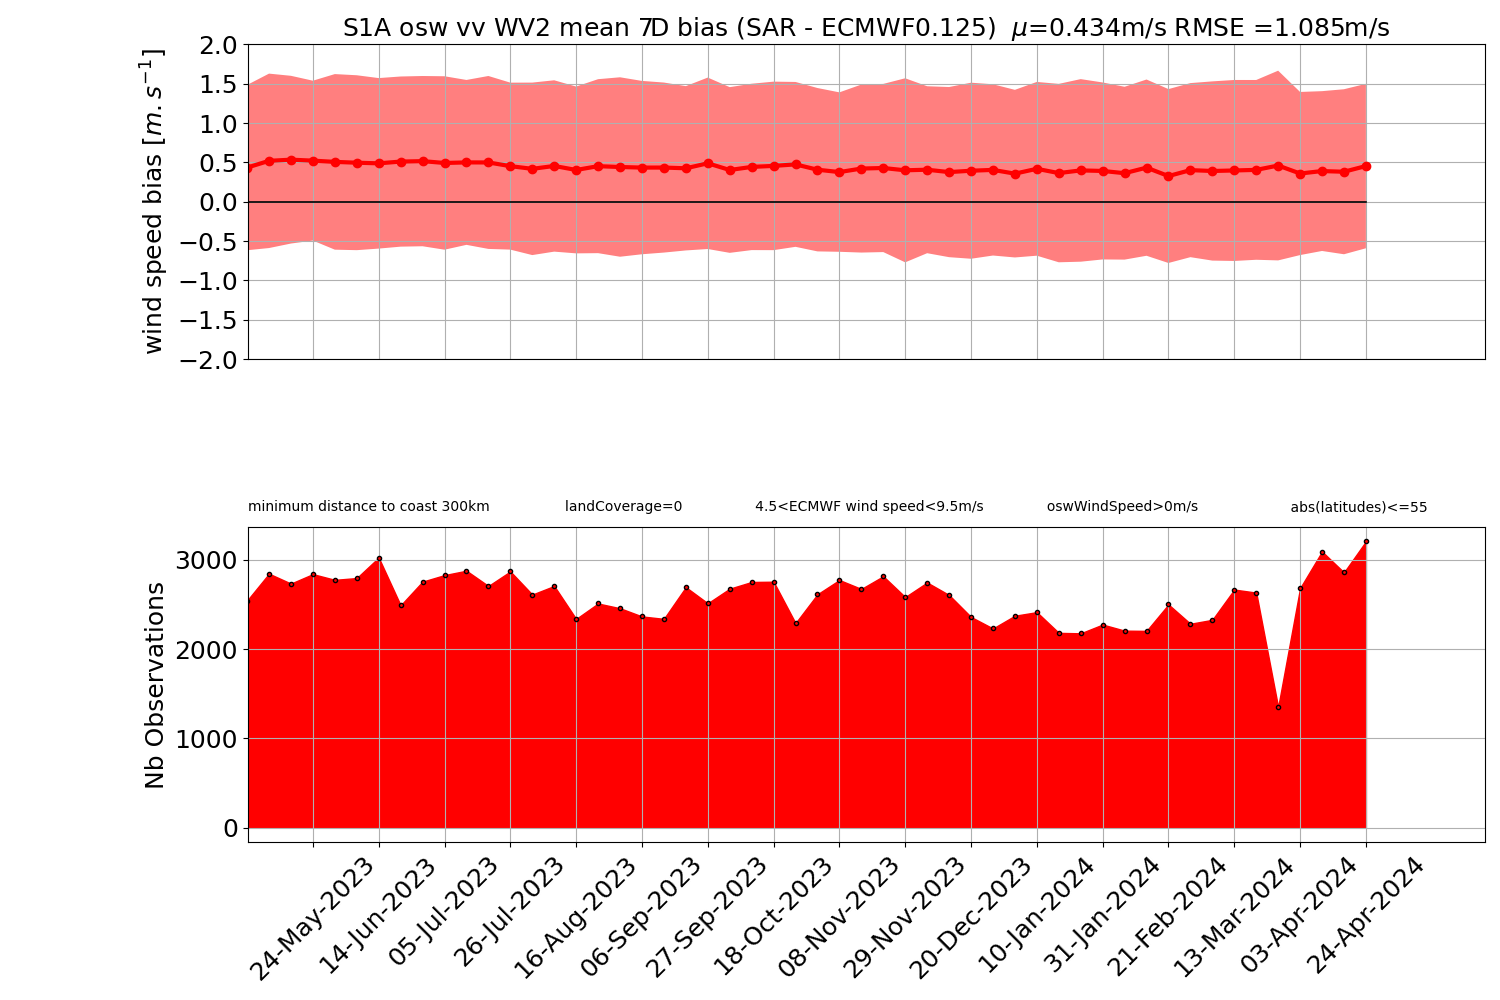
Full mission
1.3.2 OWI component
Current Year
Last 30 days
Last 365 days
Full mission
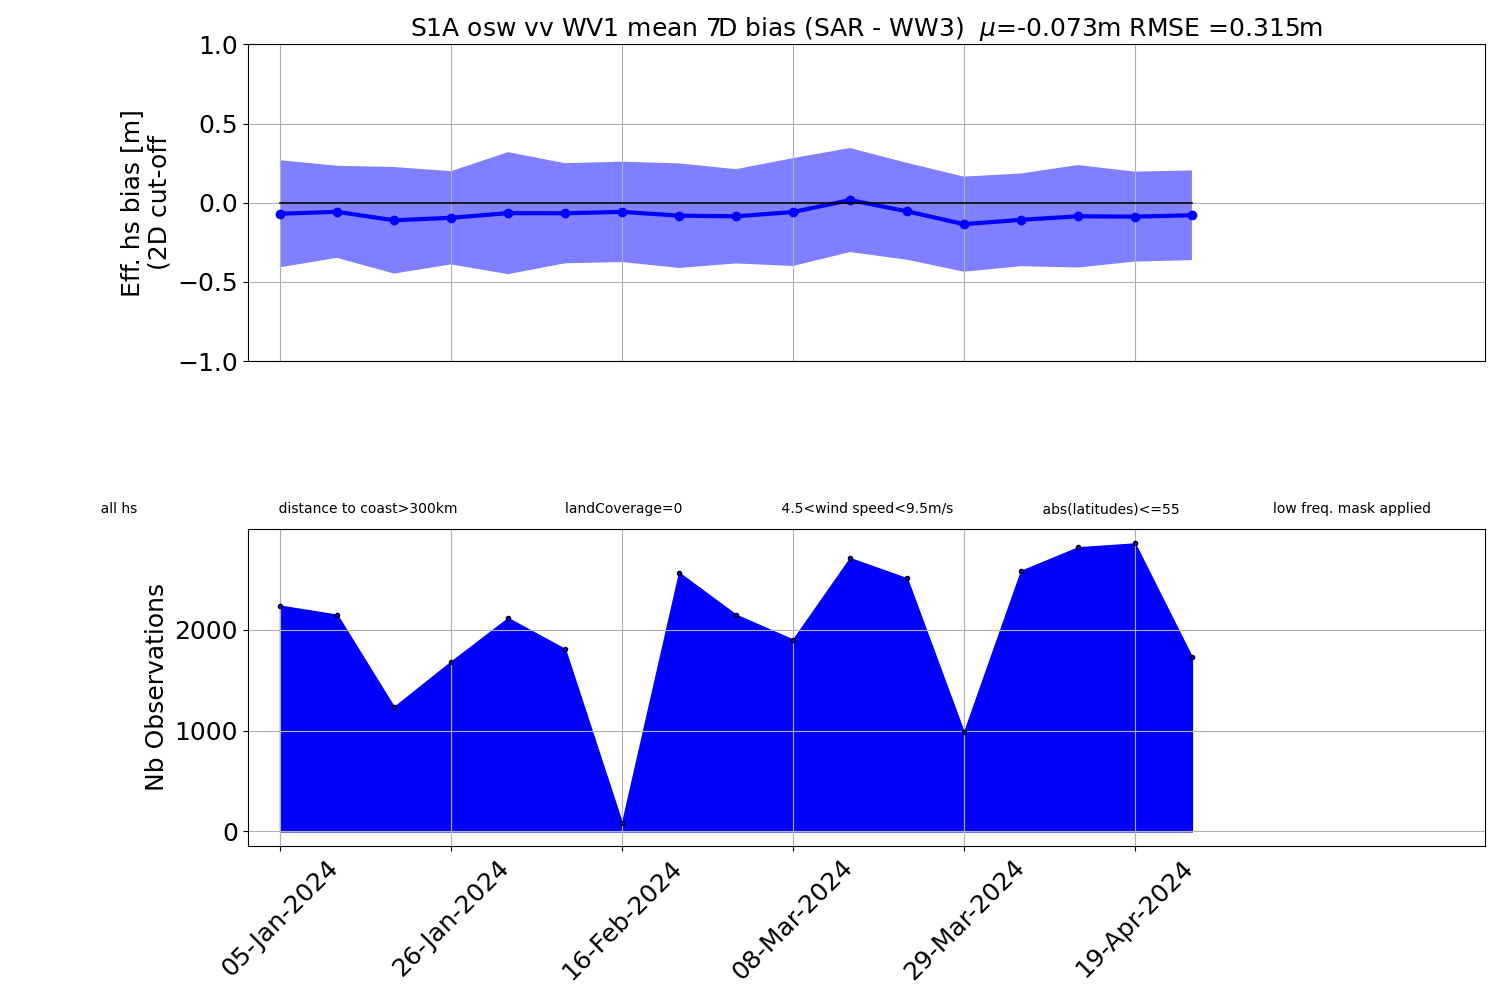
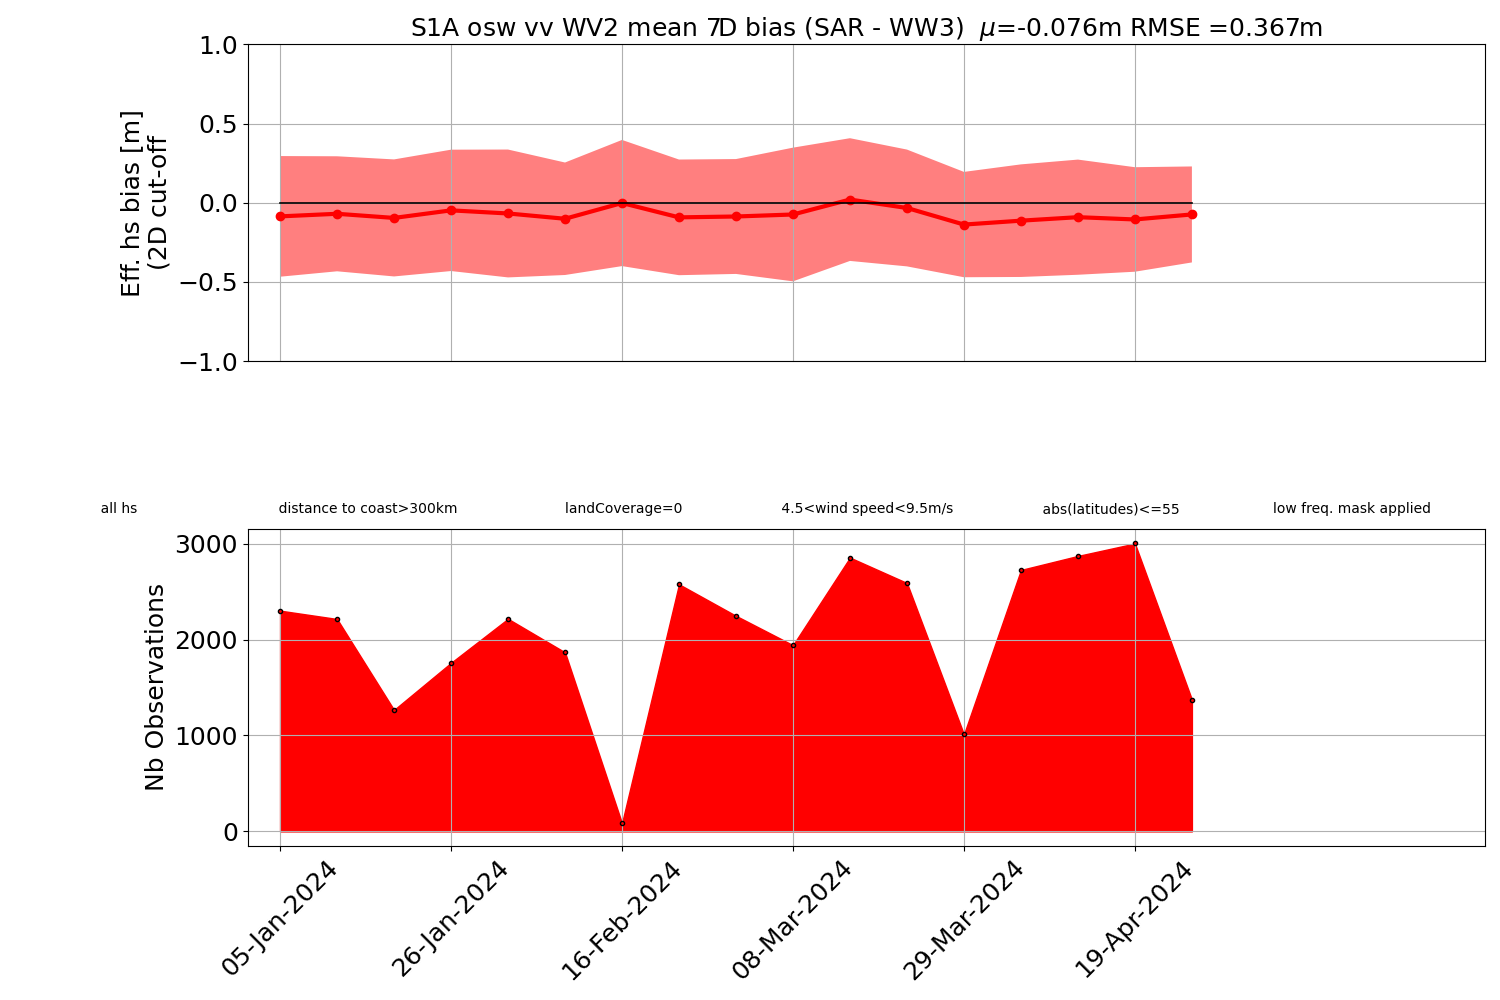
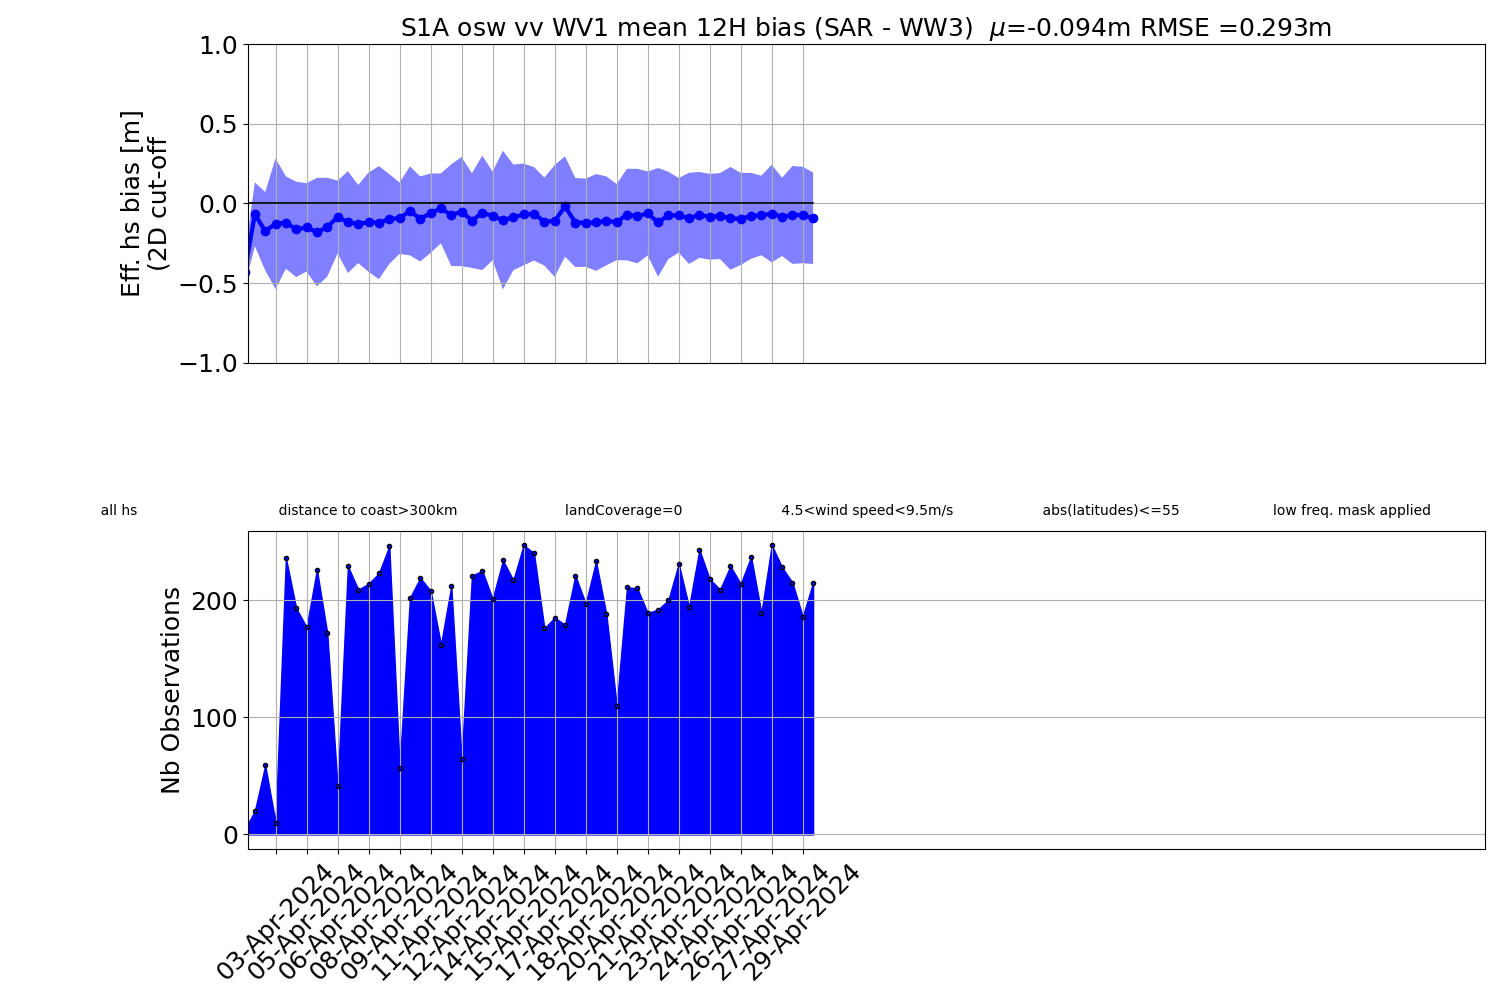
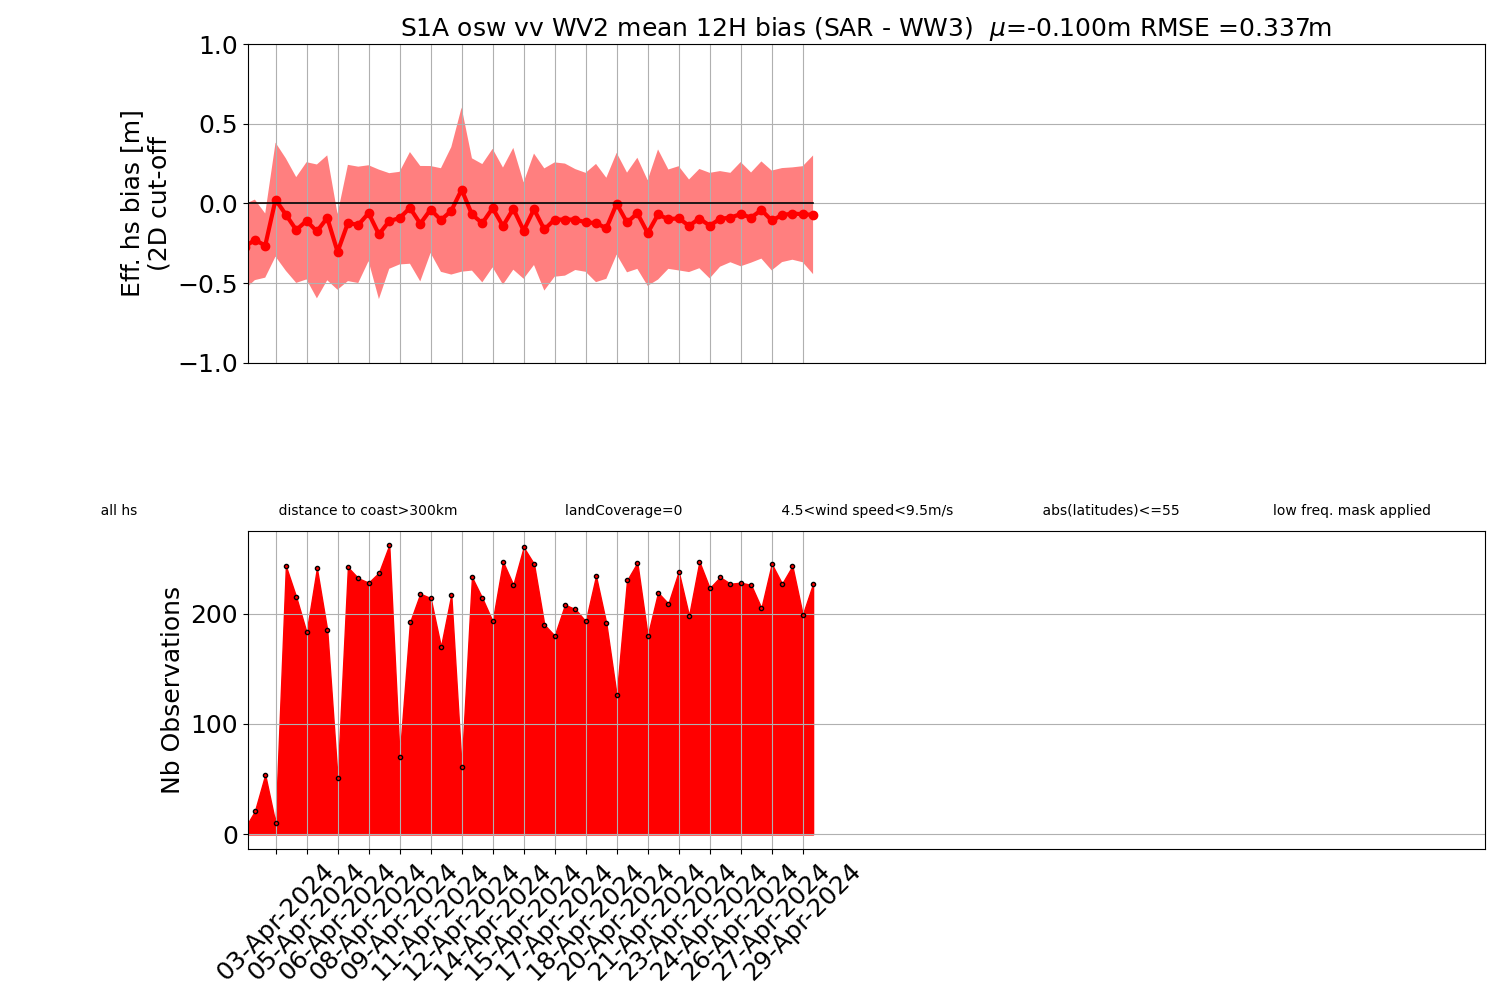
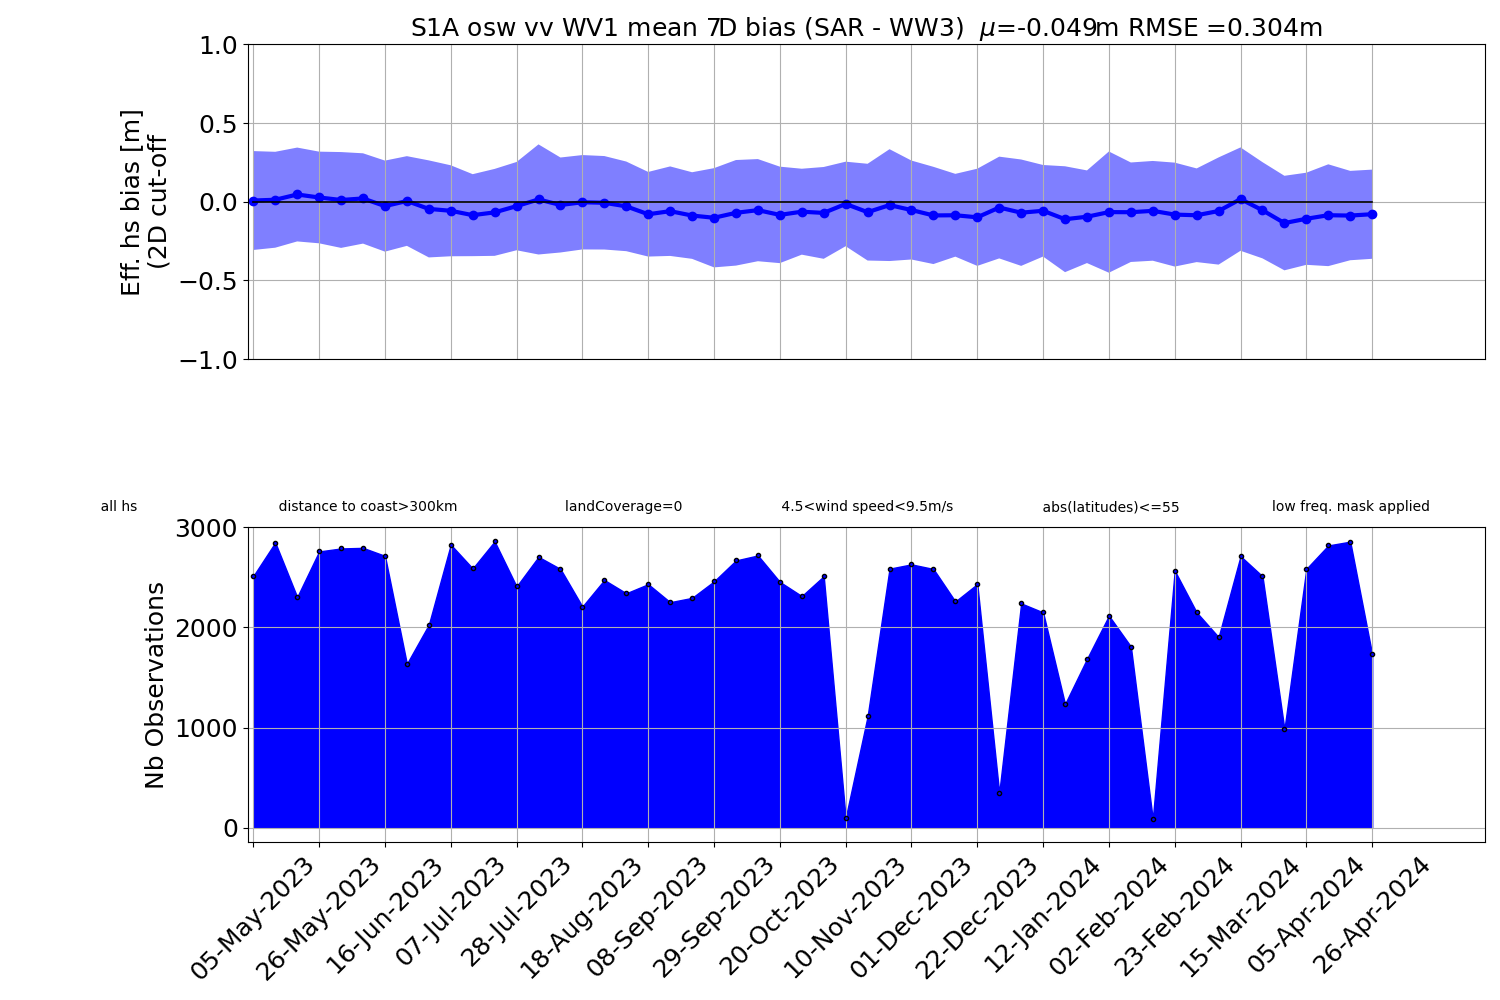
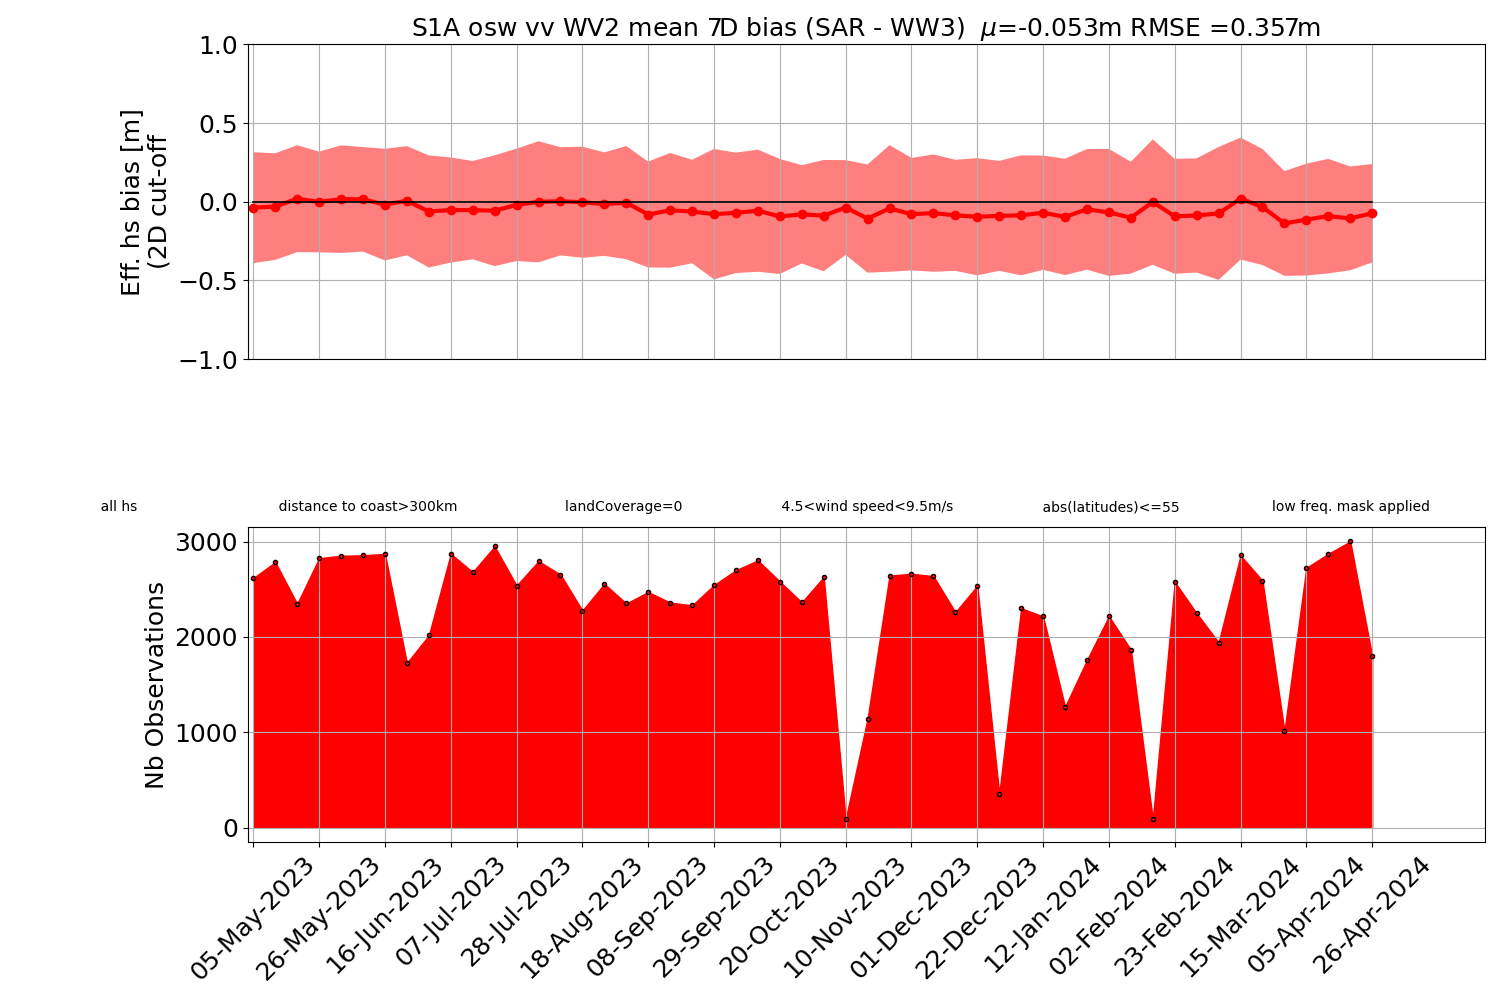
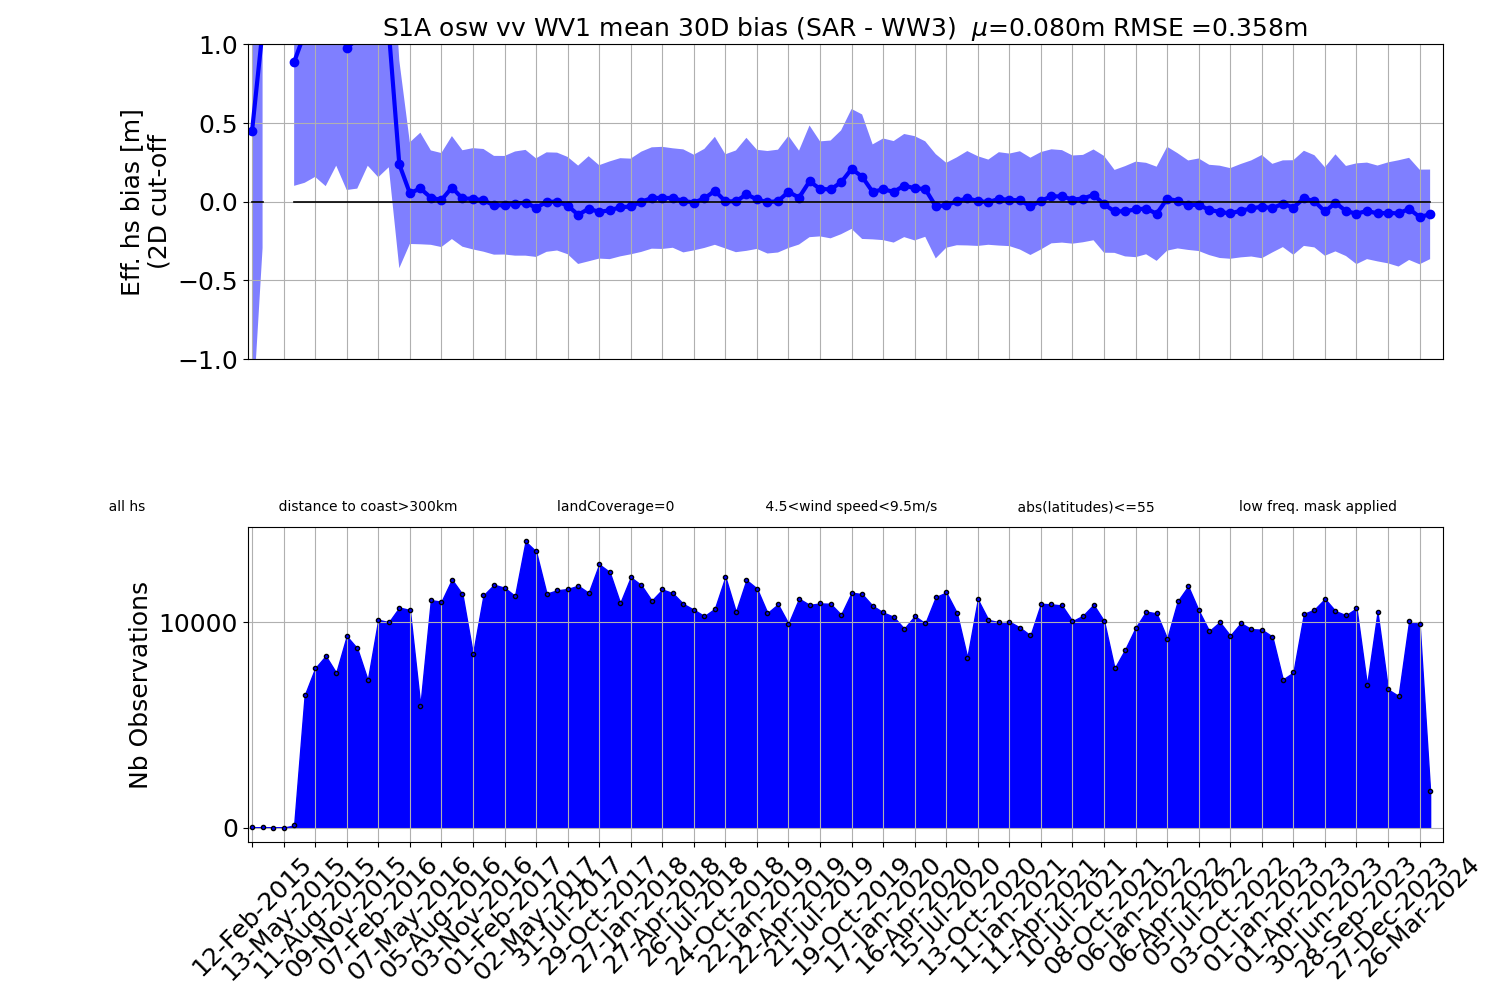
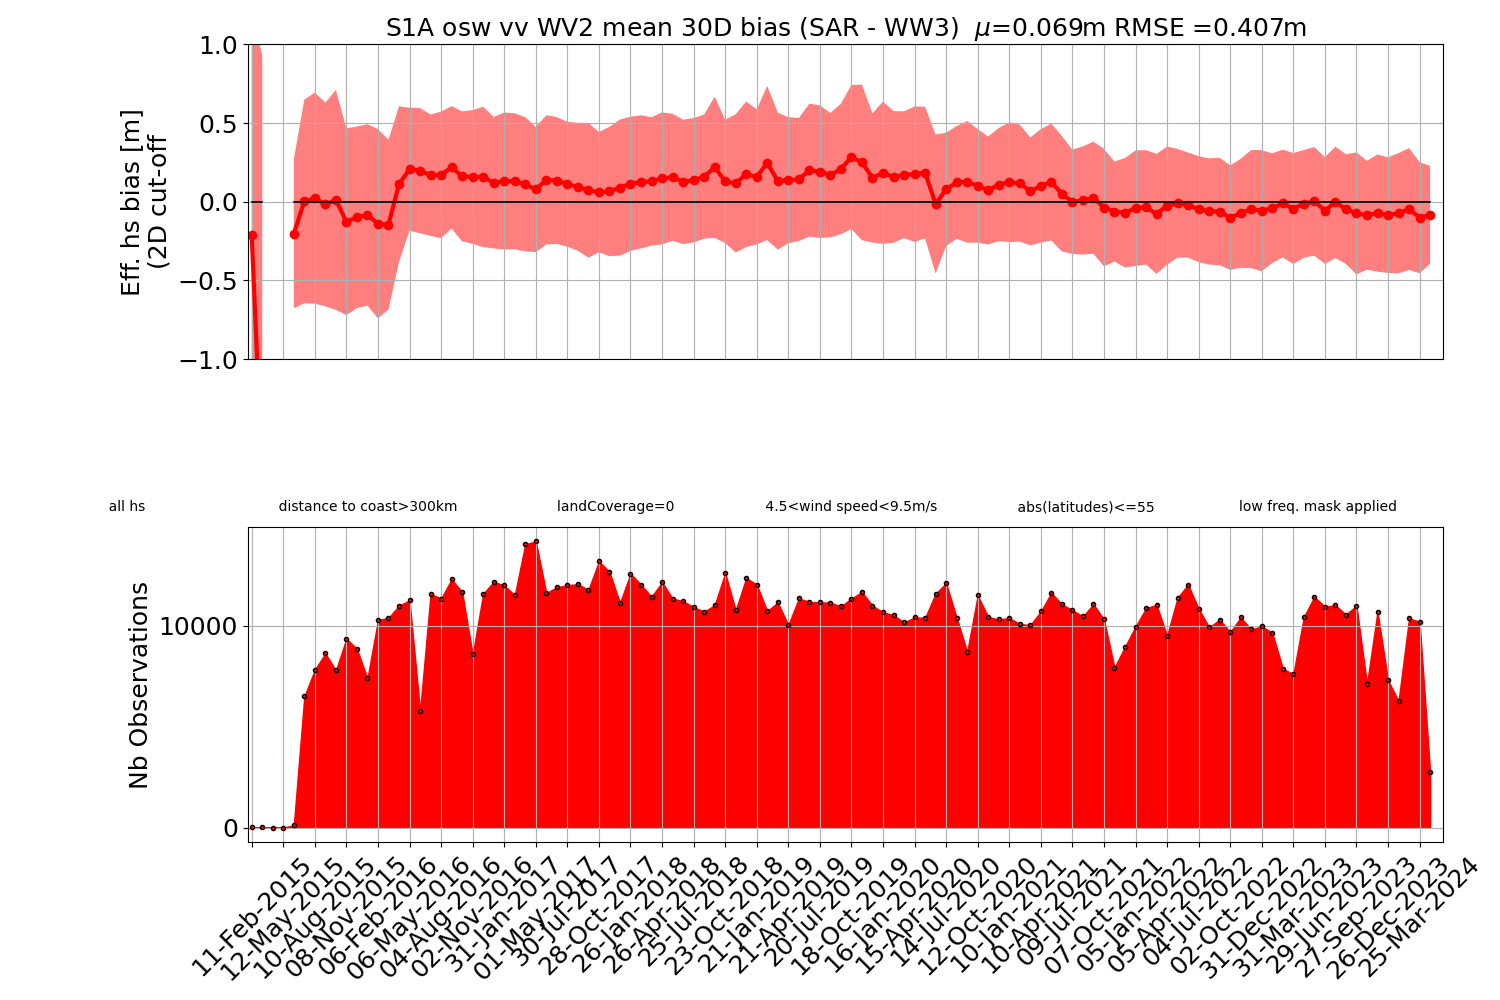
1.4 WV effective Hs mean bias from OCN Level-2 products with respect to WW3 model
1.4.1 OSW component&(-)
Current Year
Last 30 days
Last 365 days
Full mission
1.5 Calibration figures
Comparison of the NRCS distribution for WV1 (left) and WV2 (right) between observations and model.
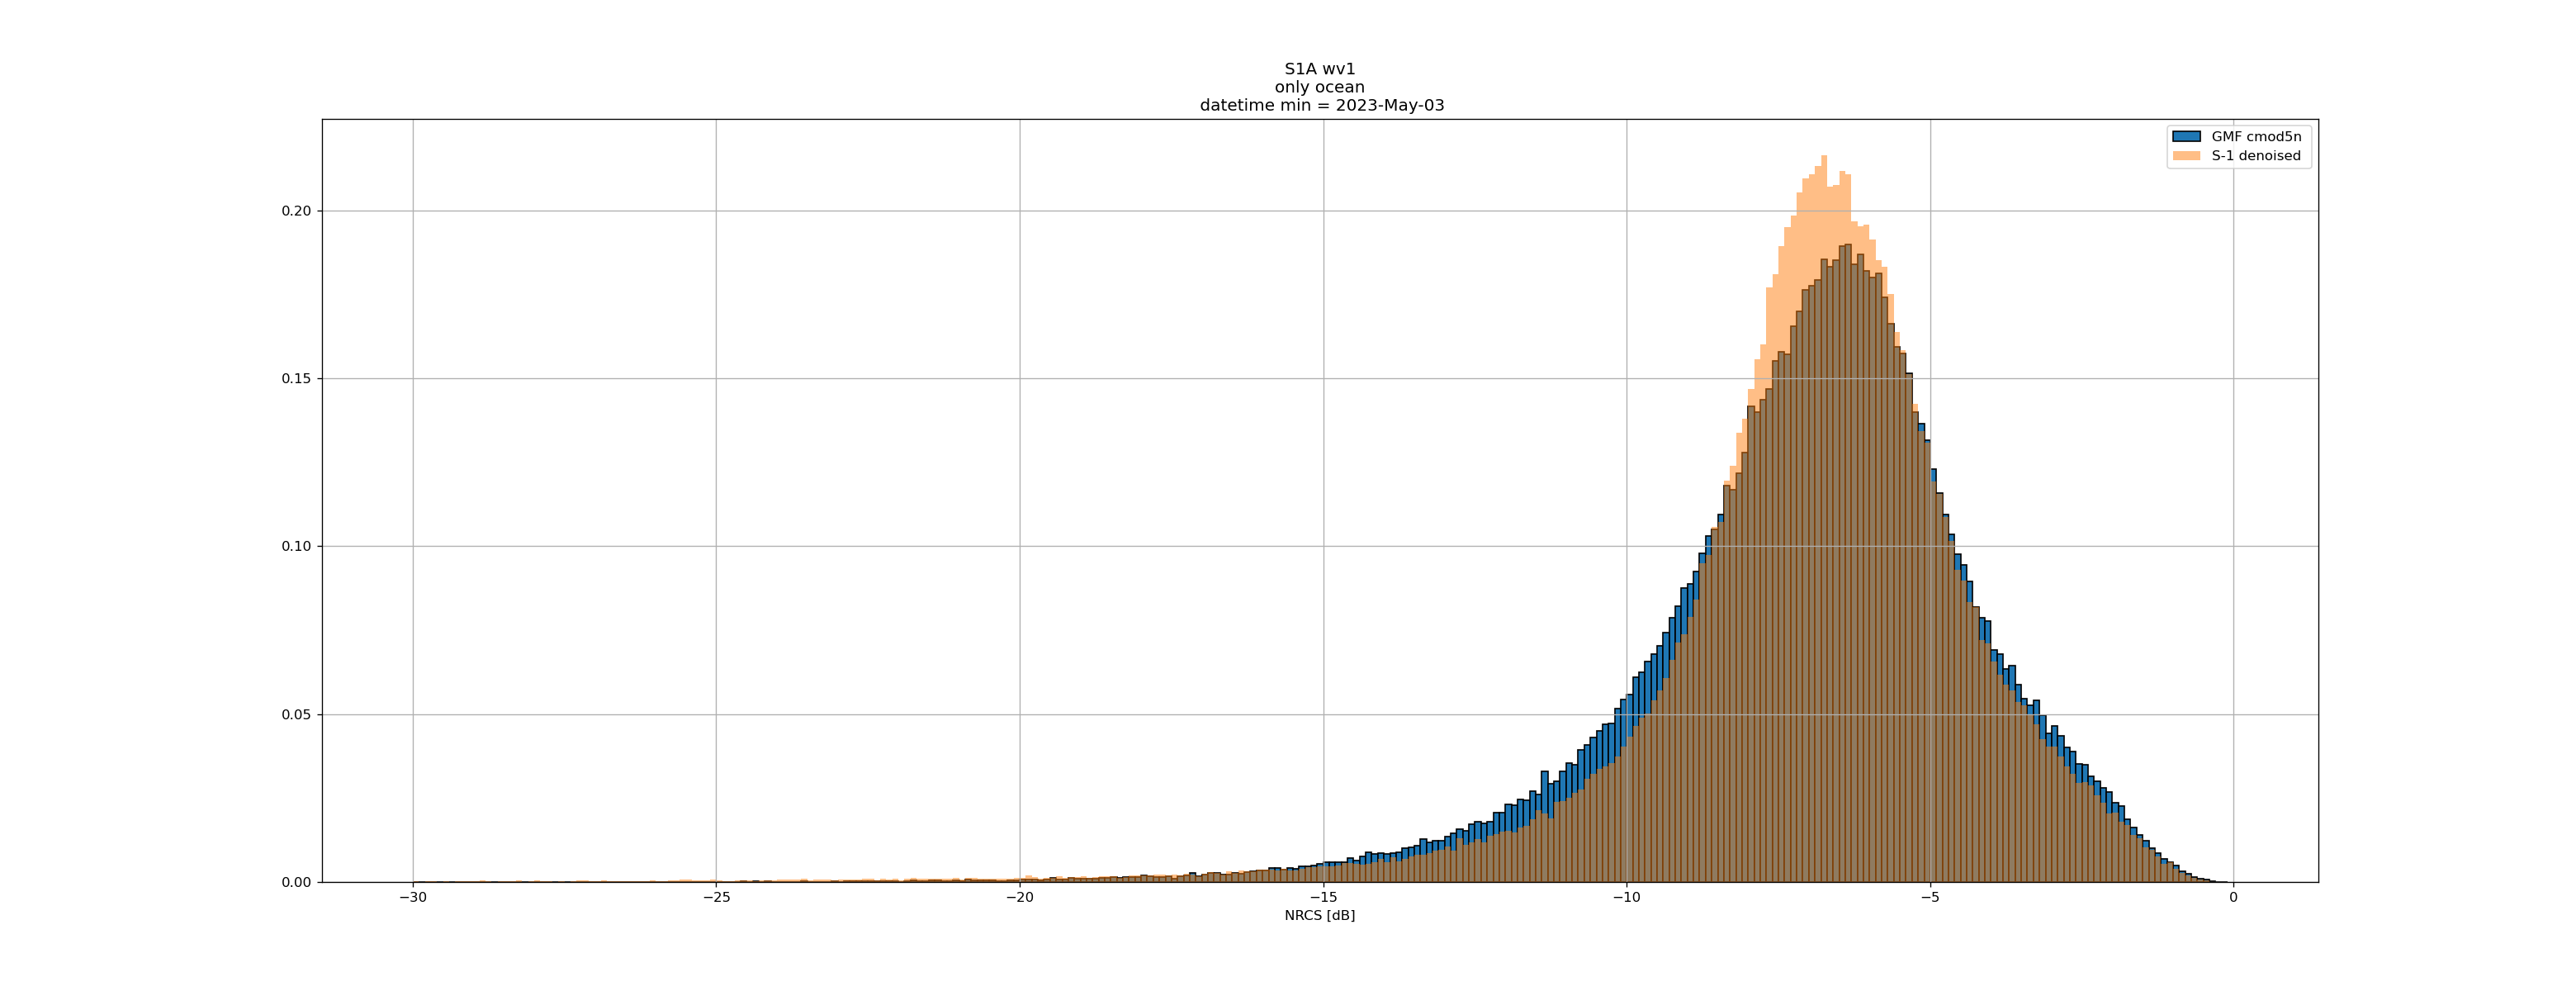
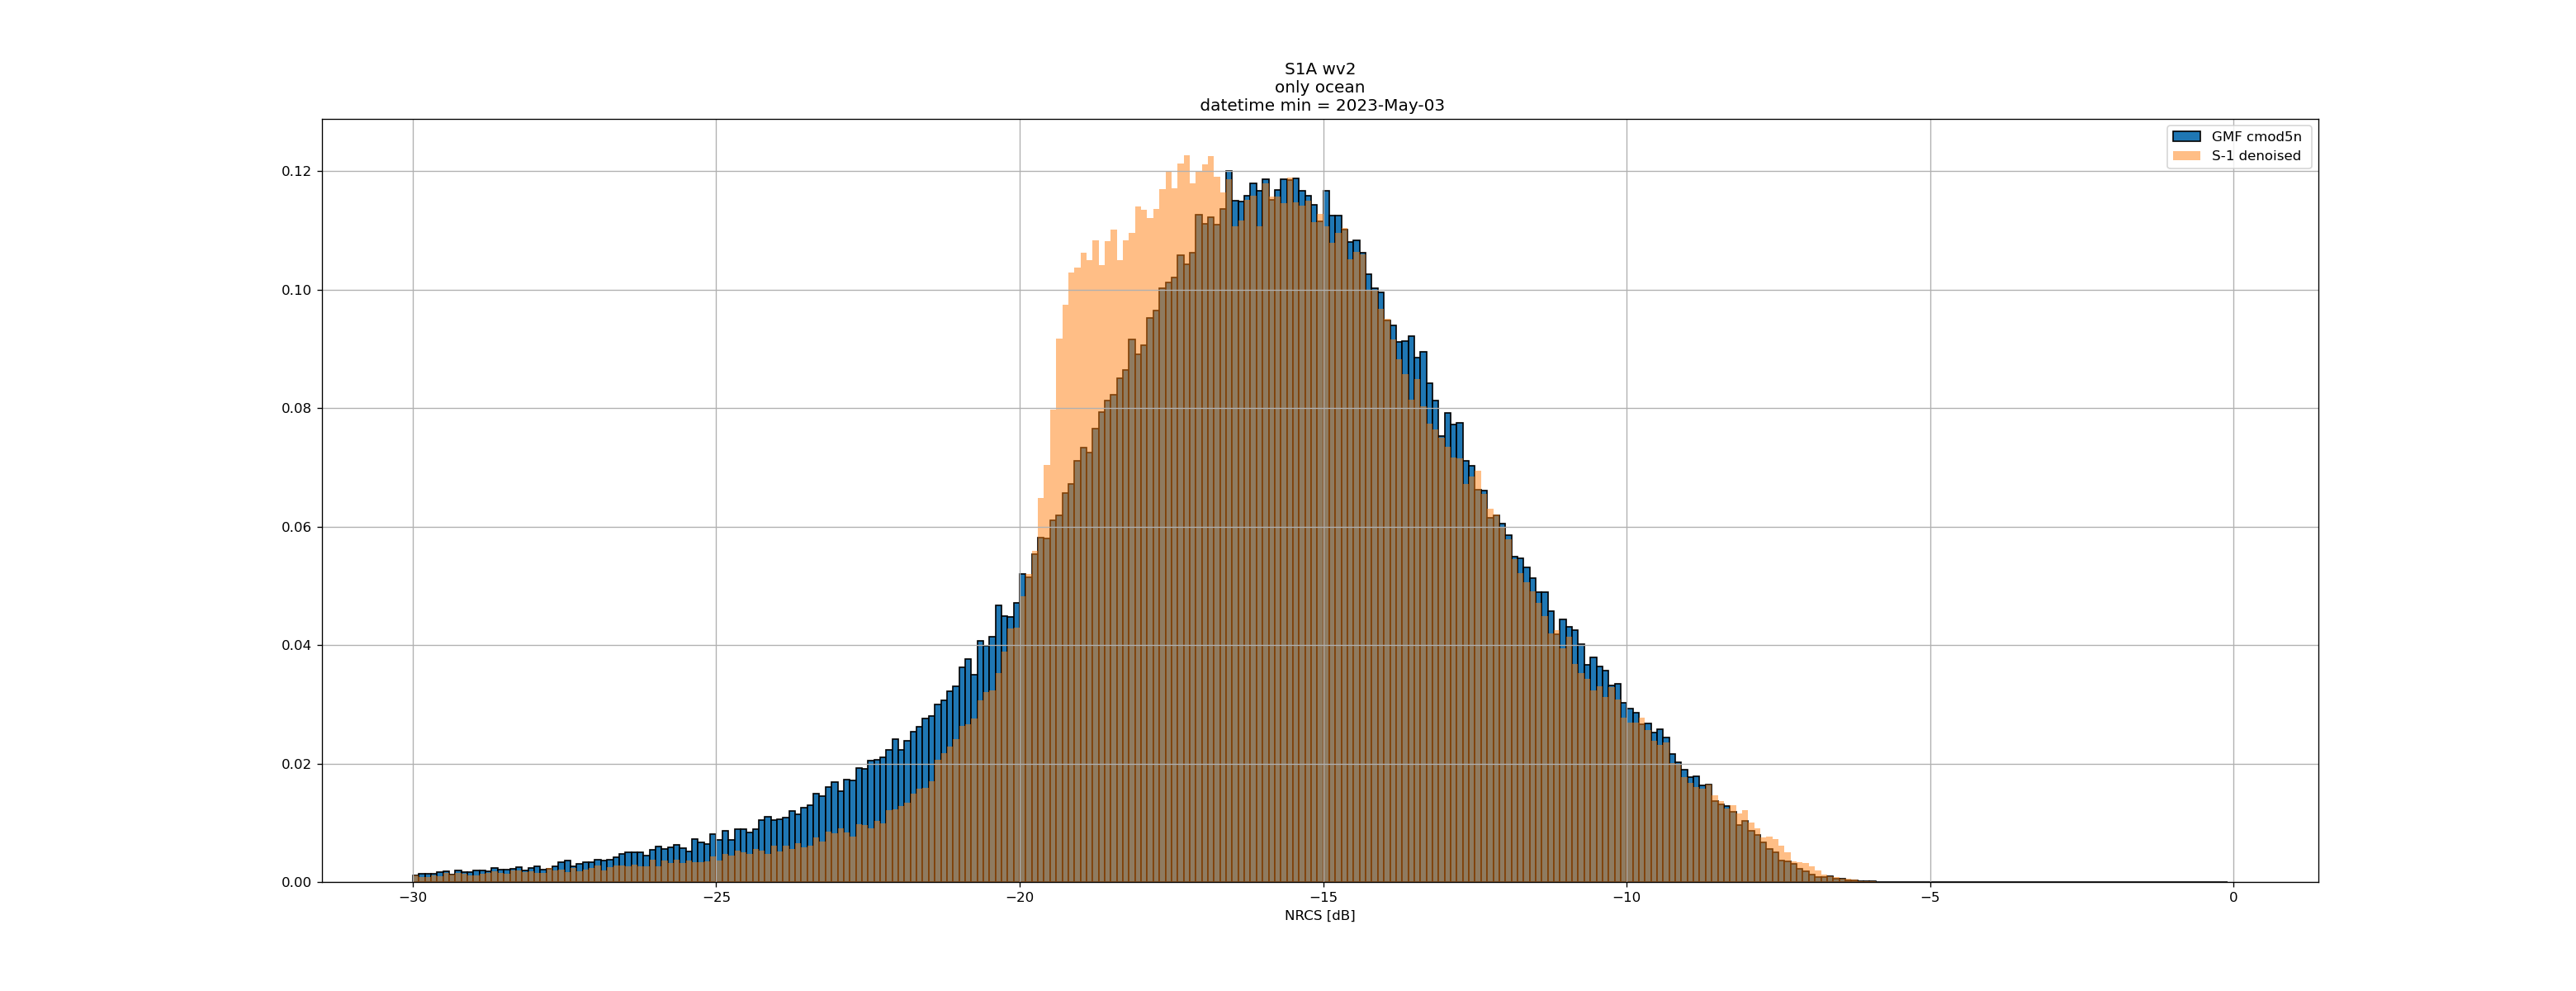
Histograms of NRCS coming from SAR observations are superimposed with normalized distribution of NRCS values computes using CMOD5n model and ECMWF model.
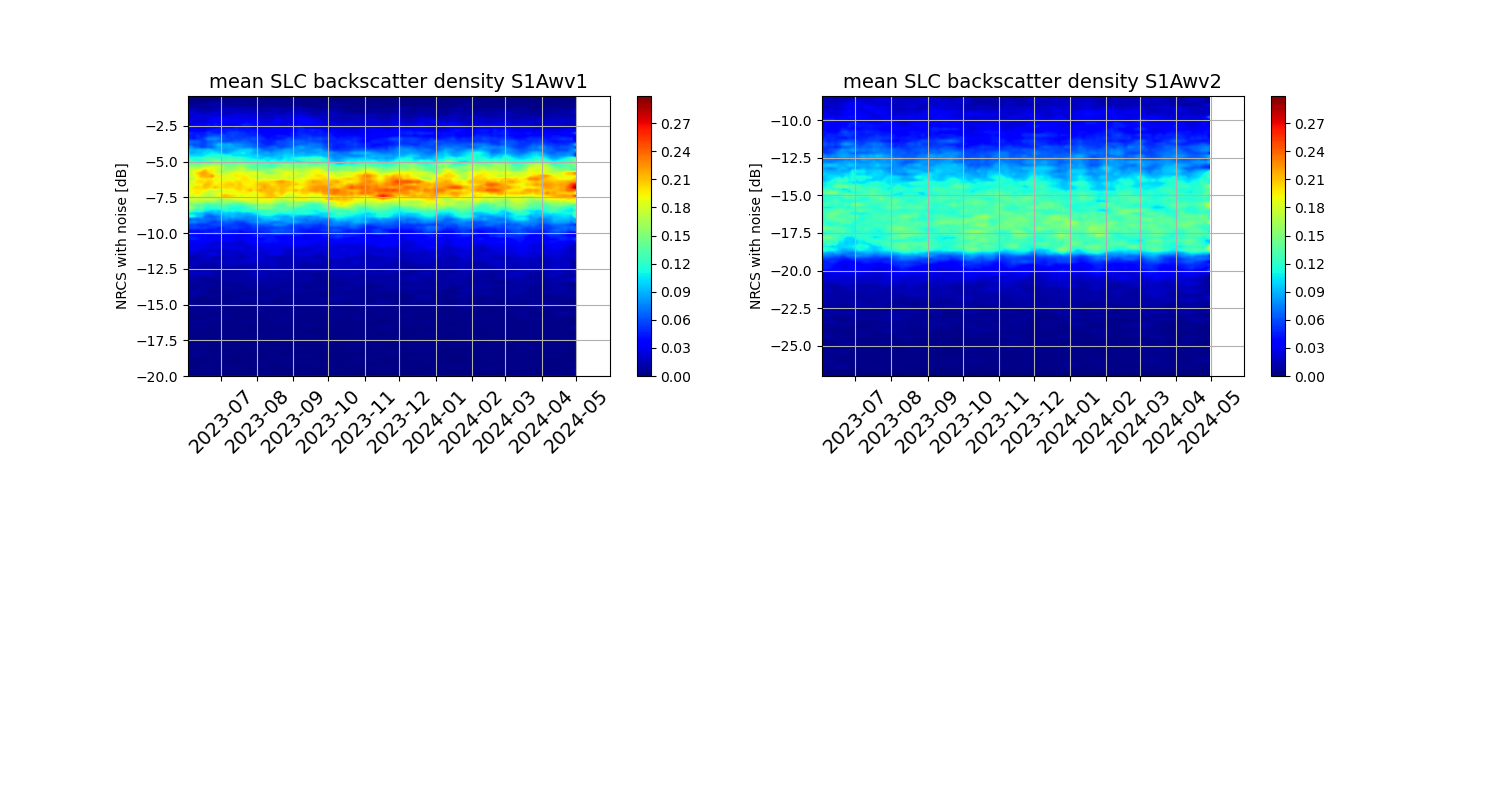
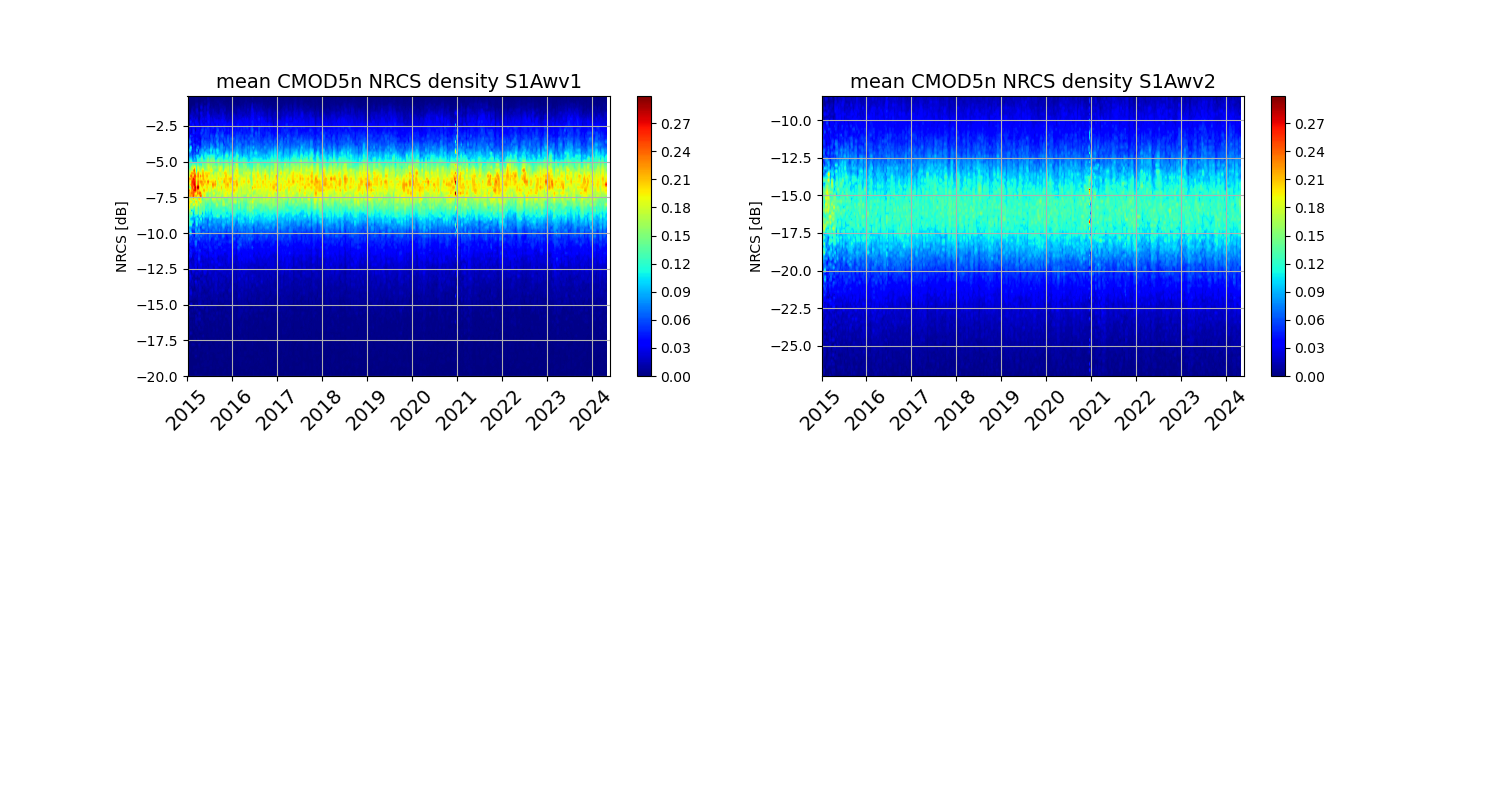
Following figures are showing the mean NRCS distribution from SLC products over the time per bin of 3 days. The left figure is showing the 2D histogram on the last 365 days, and the right figure is showing the whole mission.
To perform denoising operation on SLC products, the noise vectors annotated in official products are used. For products IPF2.91 nose vectors are corrupted, the correction applied is te following: S1B WV1= -39.30 dB S1B WV2 =-37.44dB S1A WV1 =-38.13dB S1A WV2 =-36.84dB The left figure is showing the 2D histogram on the last 365 days, and the right figure is showing the whole mission.
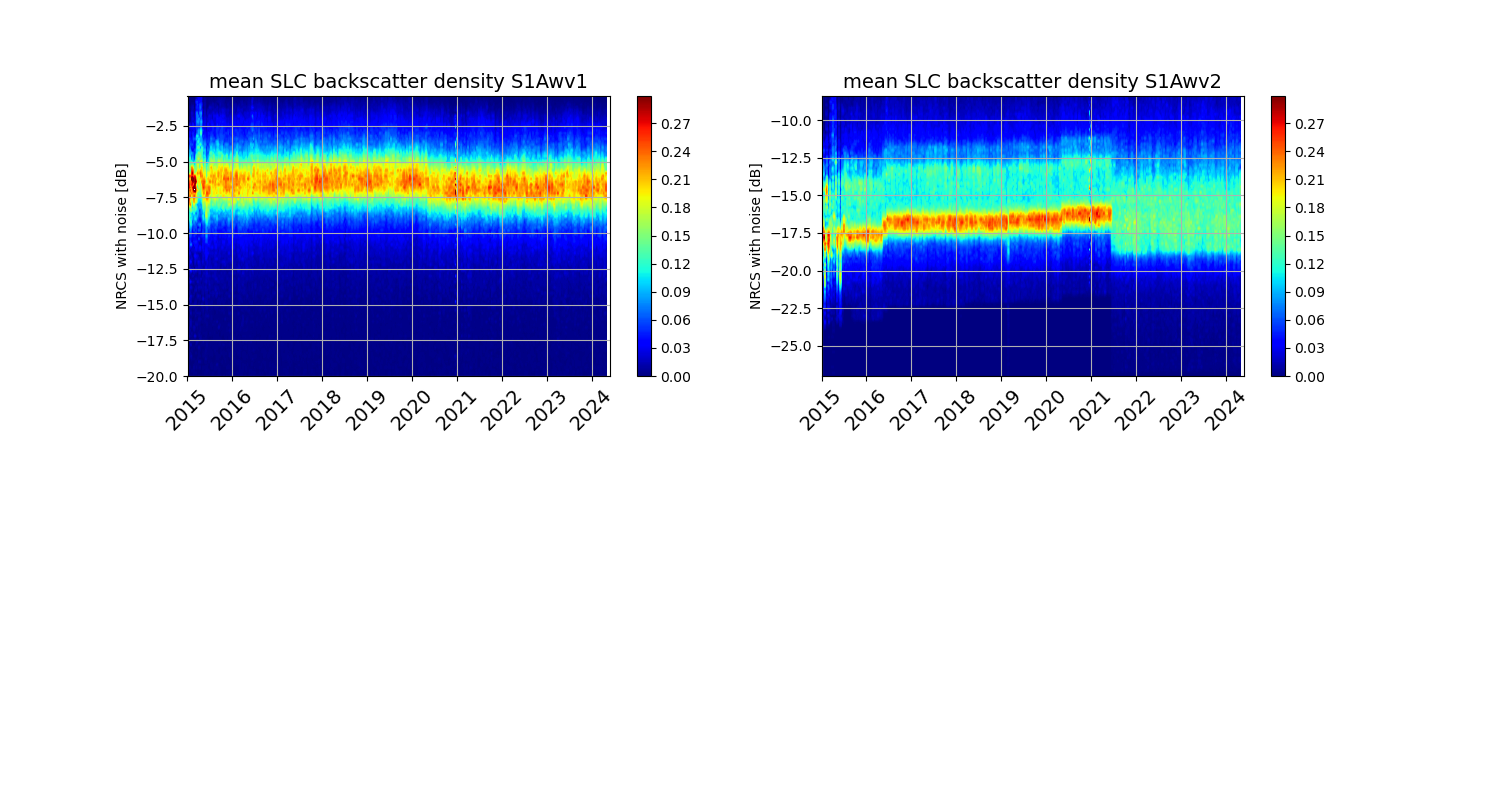
The left figure is showing the 2D histogram on the last 365 days, and the right figure is showing the whole mission.

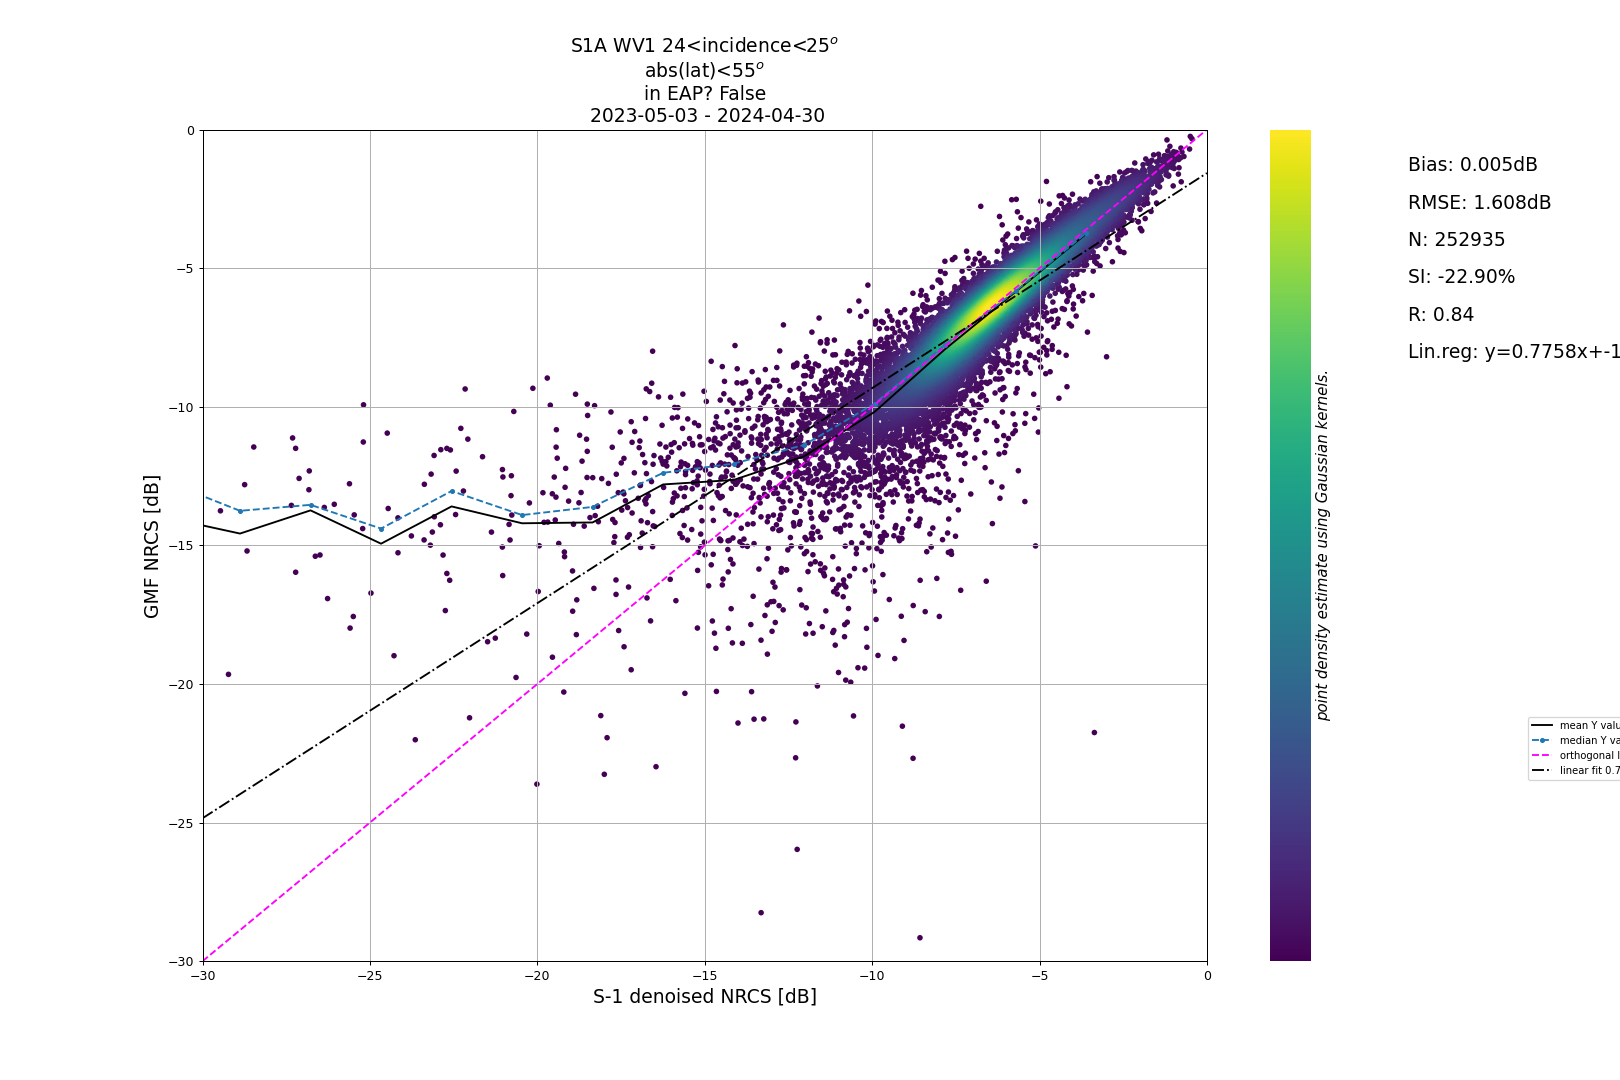
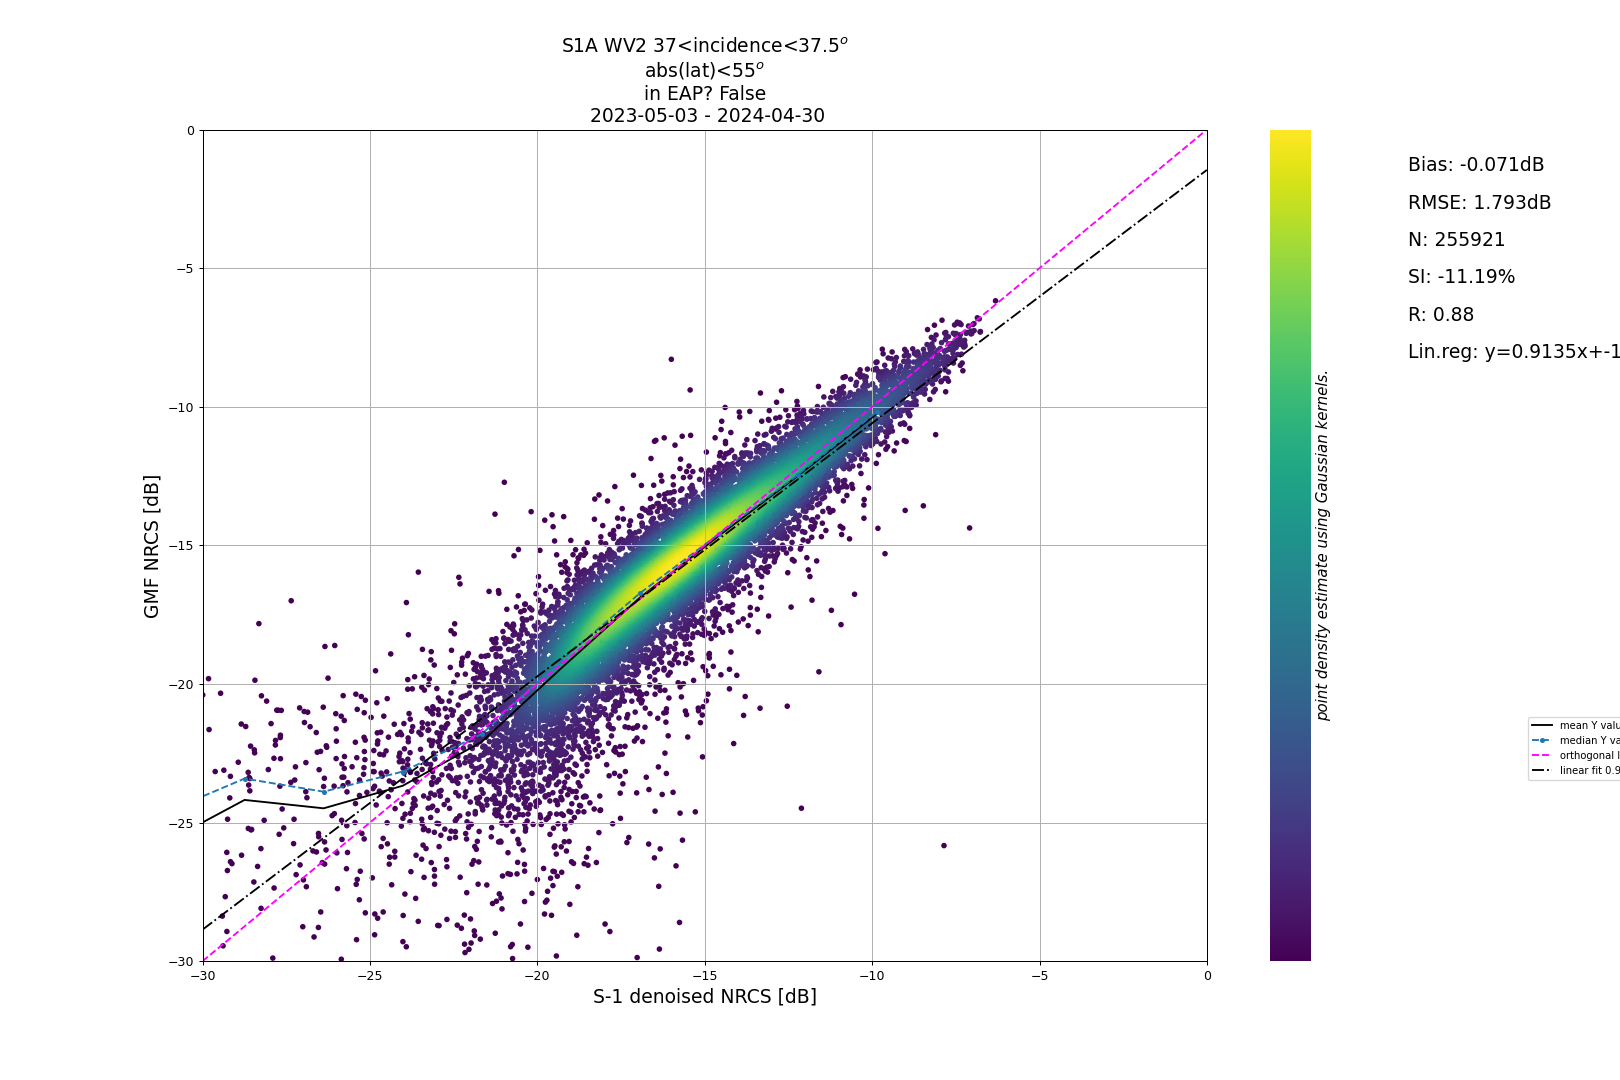
The two following figures are scatter plots to compare the NRCS values from SAR WV observations with GMF NRCS values computed using ECMWF winds.
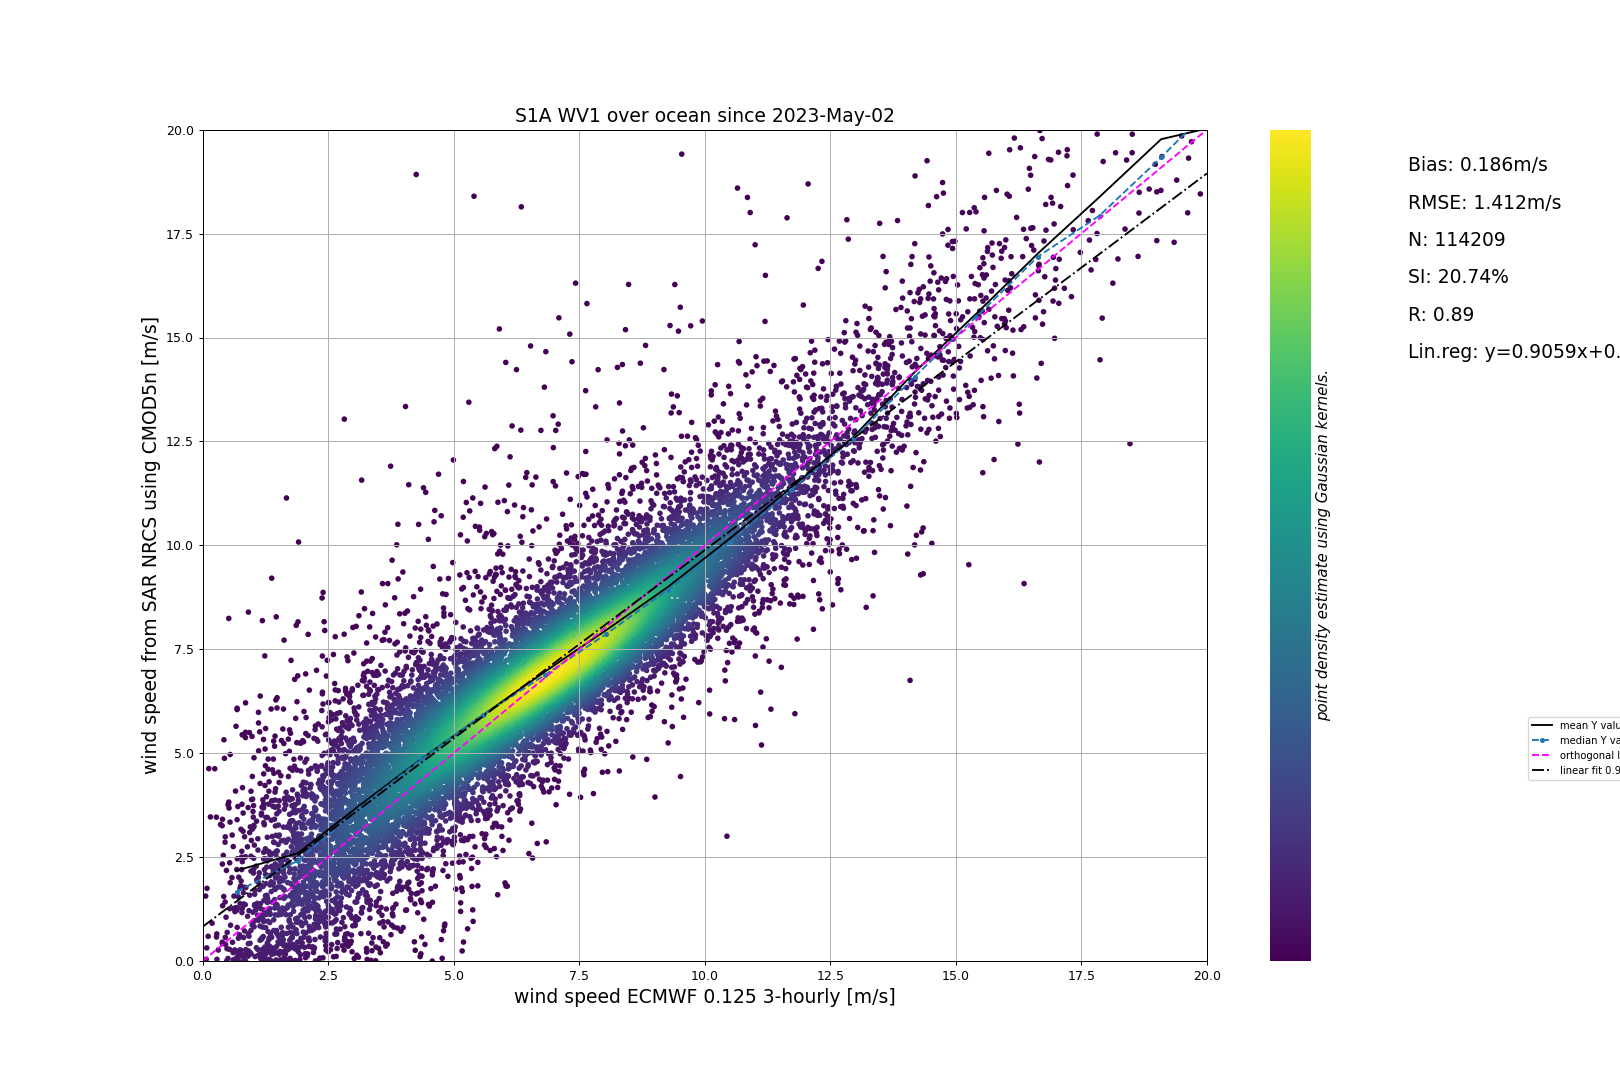
The following scatter plots are showing the wind speed performances of SAR observations befoe any NRCS correction.
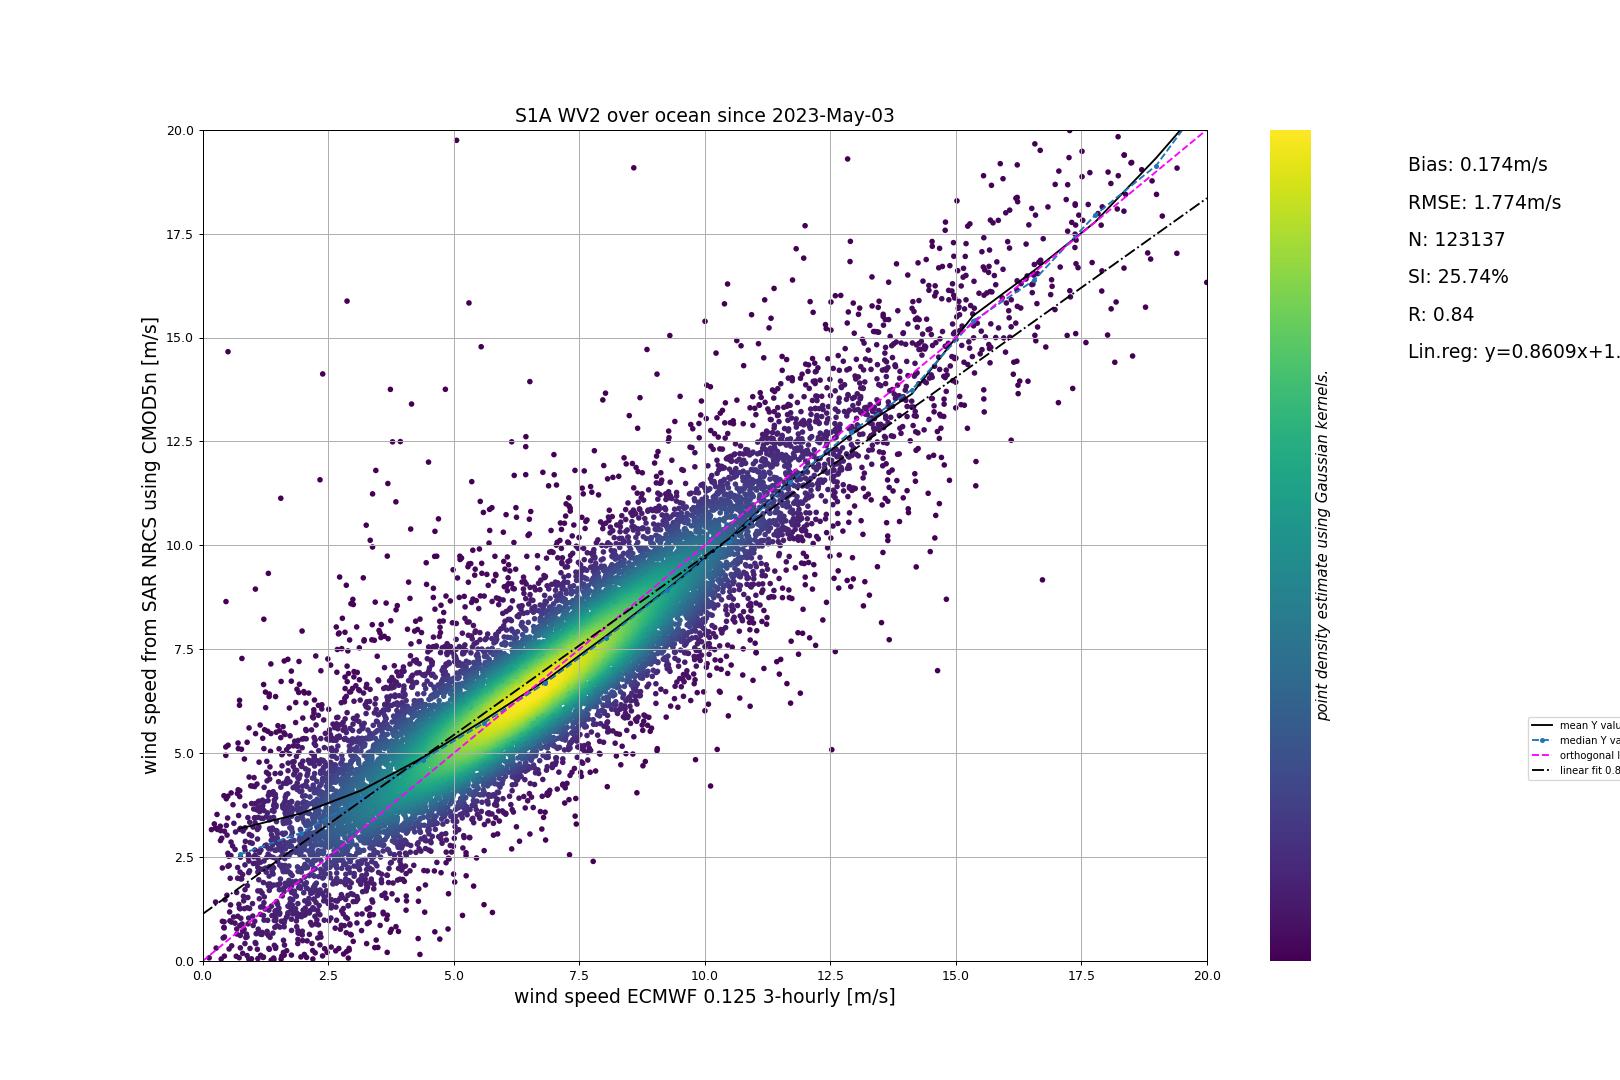
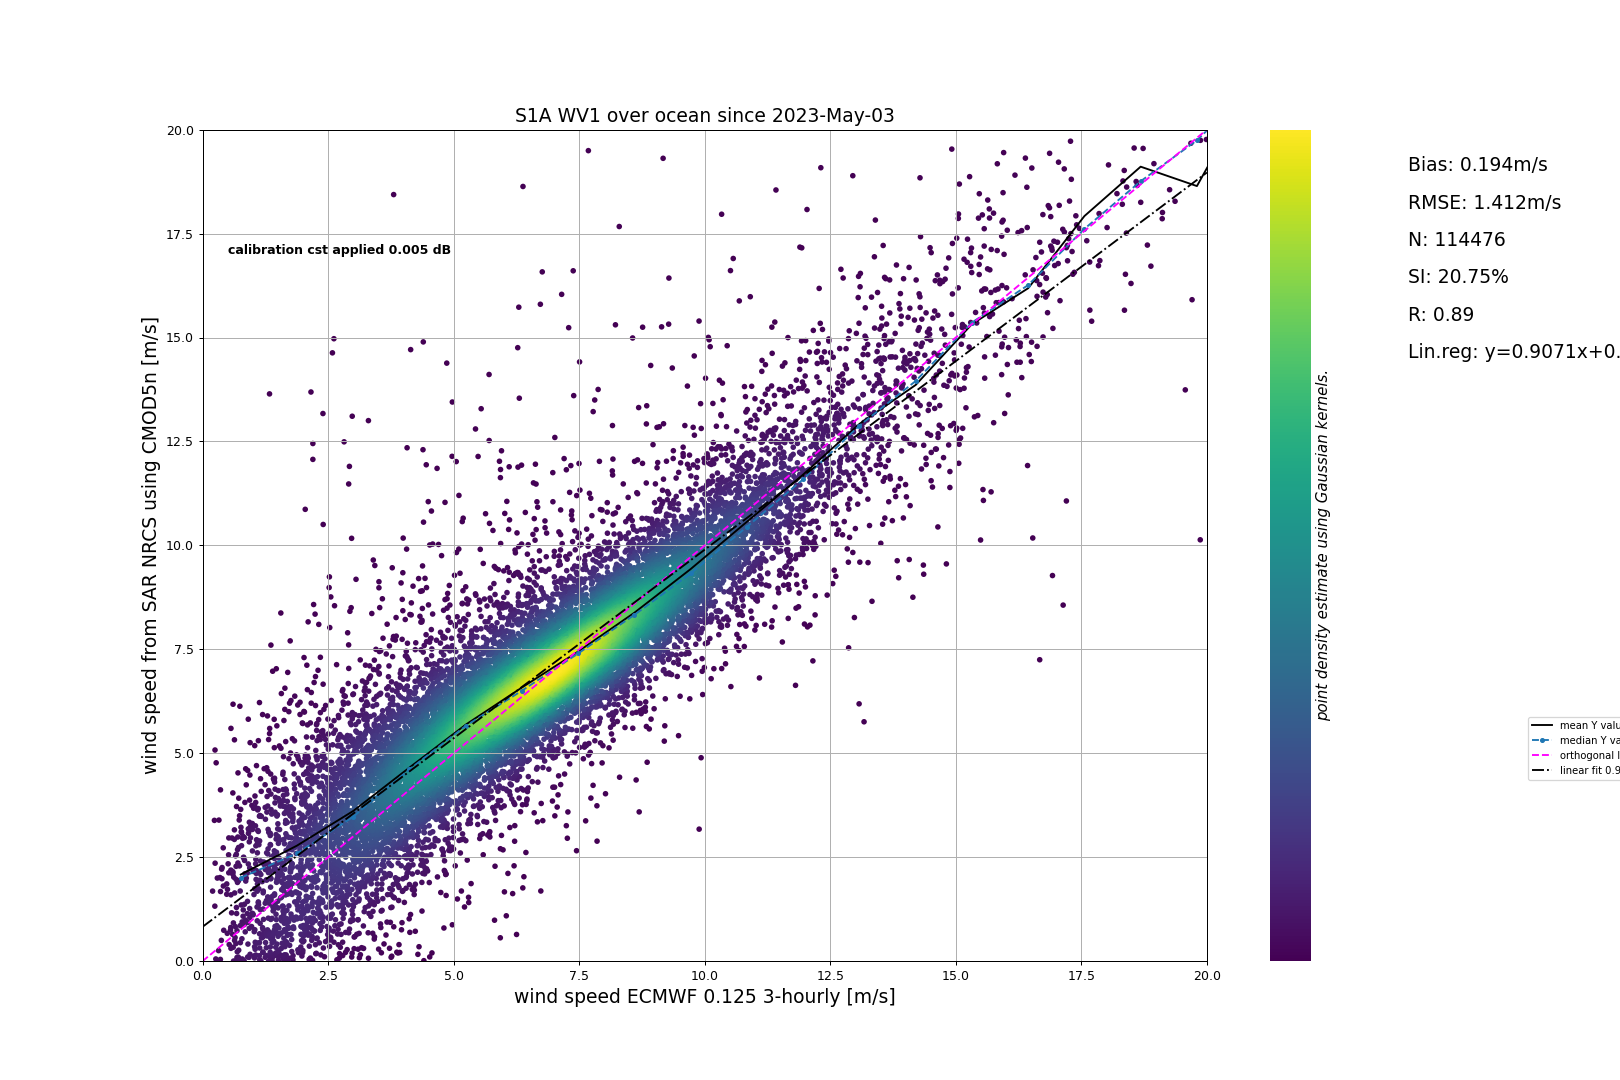
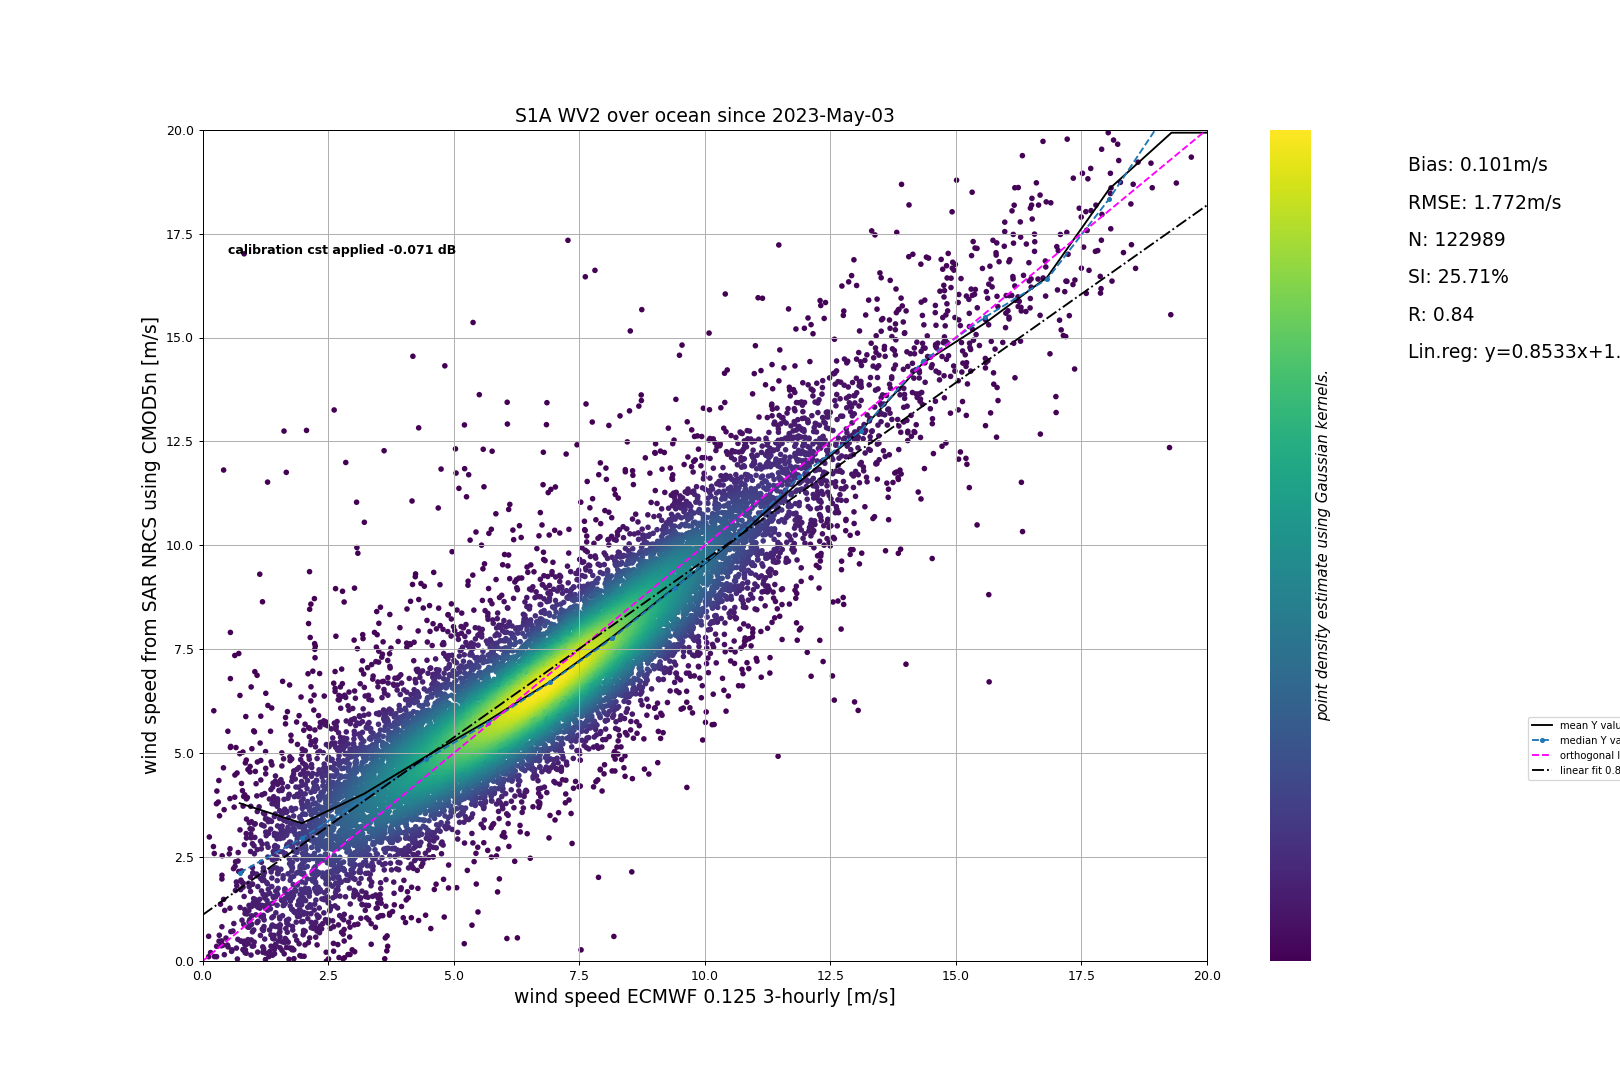
The following scatter plots are showing the wind speed performances of SAR observations when the NRCS is corrected using the mean bias found with upper figures.
The strategy of calibration for WV on Sentinel-1 is based only on geophysical ocean calibration. It is inspired from the KNMI's NOC methodology. There is no acquisition over corner reflector on WV. The main rules followed since the begining of the mission by Expert Support Laboratories in the Mission Performances Center are: 1) provide NRCS aligned with NRCS coming from CMOD models and using ECMWF wind forecasts. 2) align as much as possible the values of NRCS annotated in the different products distributed: SLC, GRDH, GRDM, GRDF, OCN.